Module 2 Assignment – Excel Tutorials
The following tutorial is an optional resource meant to assist you in navigating the databases and collecting the necessary data for your analysis.
Note on recording your responses: In the assignment you will find all the necessary fields to record your answers and the data you collect. You will also find an optional Answer Sheet Excel file to keep record of the collected data and your findings. You will find this file in the assignment’s introduction.
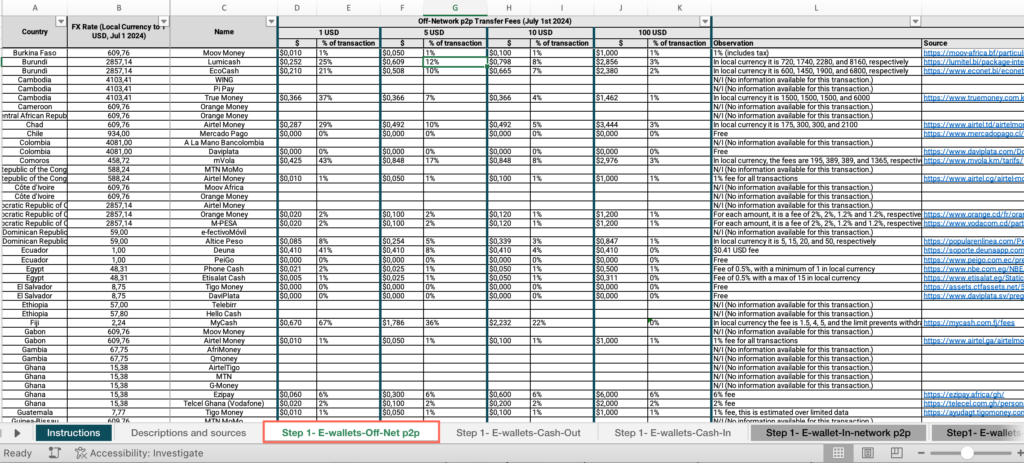
Step 1: What are the fees for transferring 1/5/10/100 USD off-network in USD and as a percentage of the transaction amount?
- In the M2-How to carry out a price analysis-databases Excel file, open the “Step 1- E-wallets-Off-Net p2p” sheet.
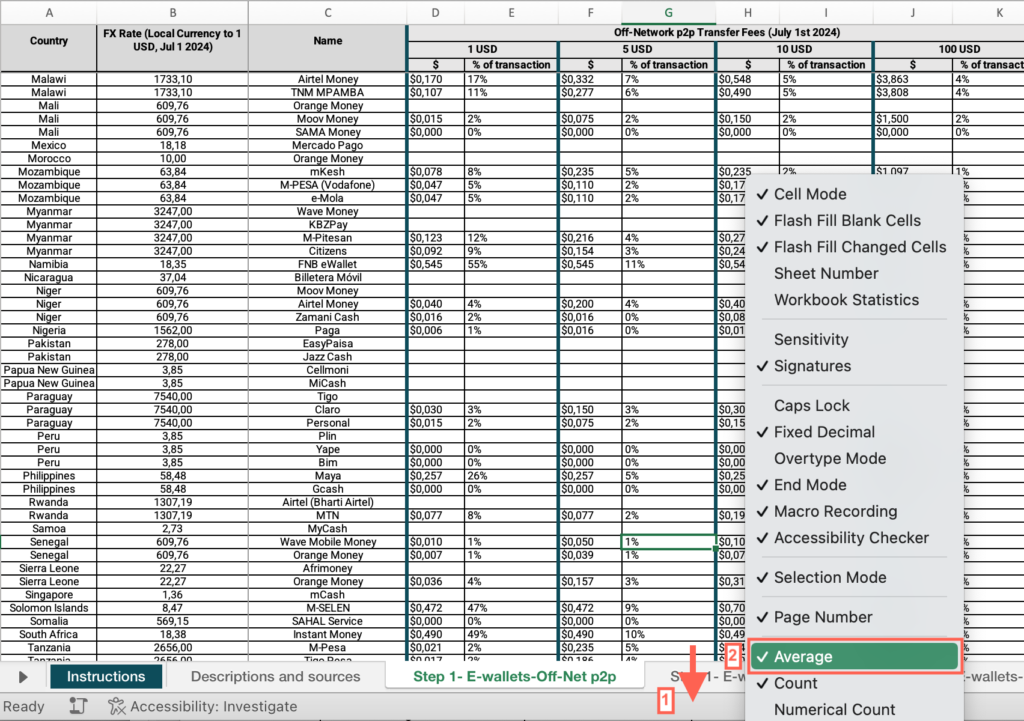
- Right-click on the status bar at the bottom of the Excel window. In the dialog box that appears, ensure that the checkbox for “Average” is checked.
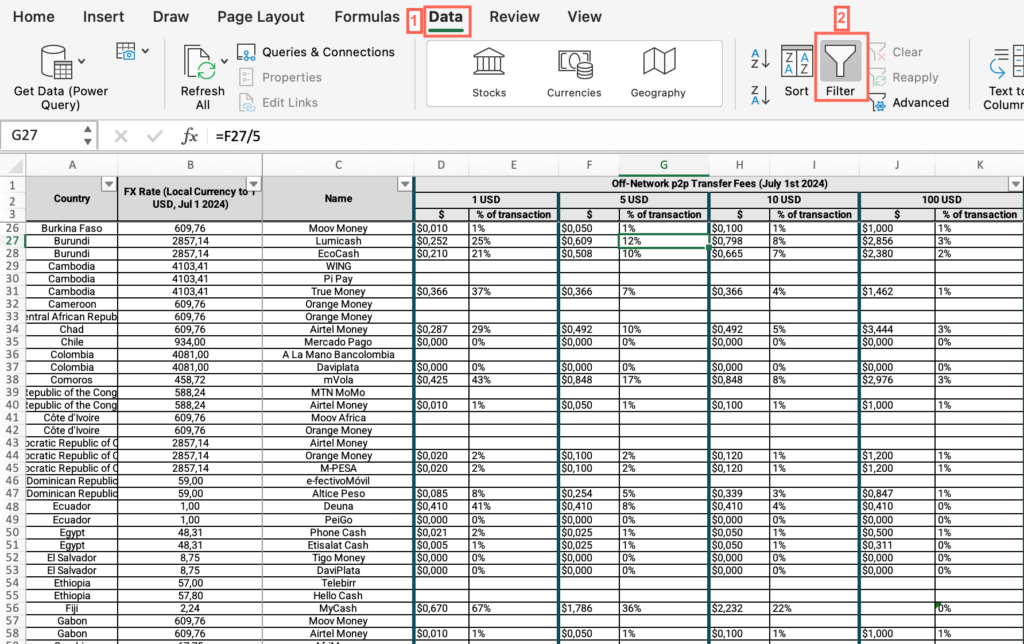
- Select the header row > click the Data menu > Select “Filter”.
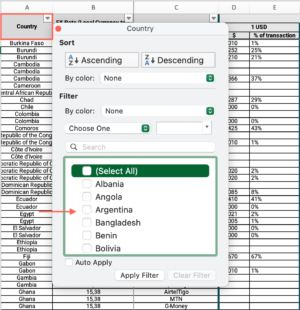
- Now that “Filter” is enabled, click on the dropdown arrow in the “Country” column header > Uncheck “Select All” > Check the box for your country.
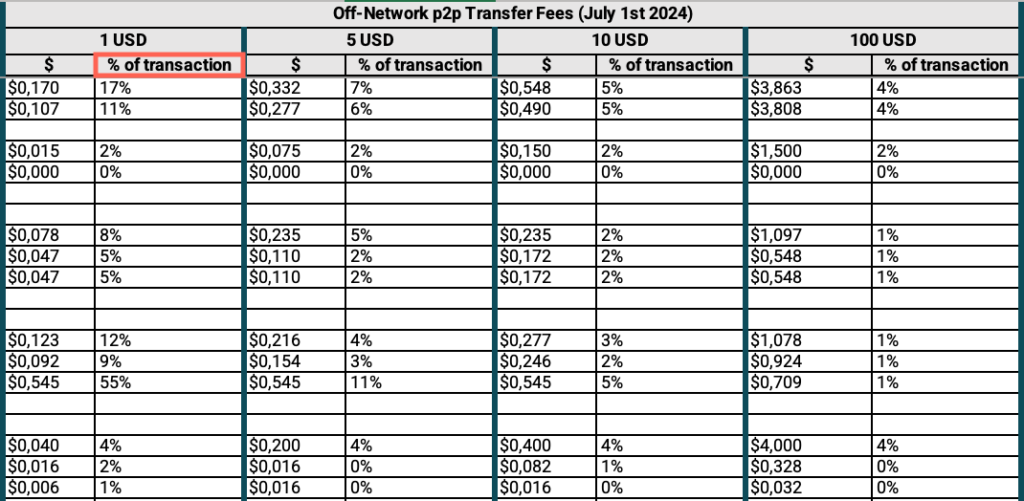
- Under the “Off-Network p2p Transfer Fees (July 1st 2024)” cell, locate the “1 USD” cell > Find the “$” column > Find the value and answer the question on the platform.
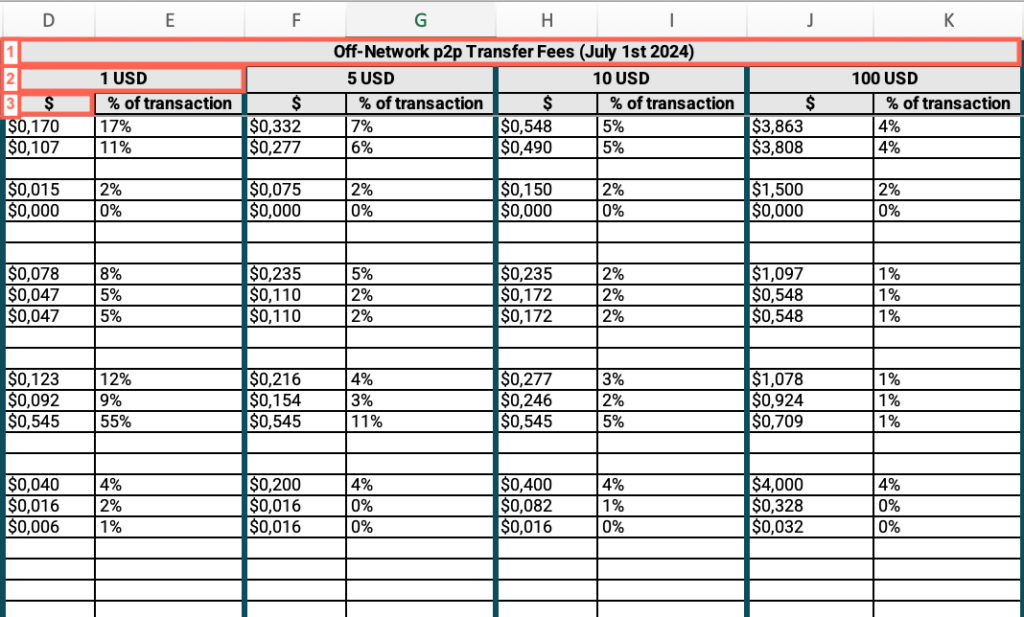
- Repeat these steps for 5 USD, 10 USD and 100 USD.
- Under the “Off-Network p2p Transfer Fees (July 1st 2024)” cell, locate the “1 USD” cell > Find the “% of transaction” column > Find the value and answer the question on the platform.
- Repeat these steps for 5 USD, 10 USD and 100 USD.
Step 1: Are the fees for transferring 1/5/10/100 USD off-network as a percentage of the transaction amount in your country higher than the average for all countries in the database?
- In the M2-How to carry out a price analysis-databases Excel file, open the “Step 1- E-wallets-Off-Net p2p” sheet.
- If you have applied the filter by your country, locate the “Country” column > Apply the filter > Check “Select all.”
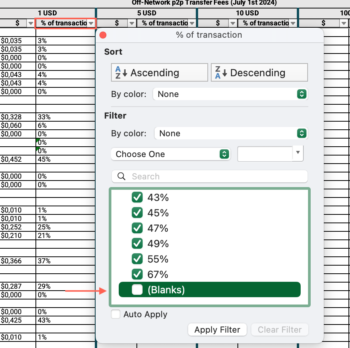
- Locate the “1 USD” cell > Find the “% of transaction” column > Apply the filter > Uncheck “Blanks.”
- Click and drag to select the entire range of cells in the “% of transaction” column > Find the average at the bottom of the sheet and answer the question on the platform.
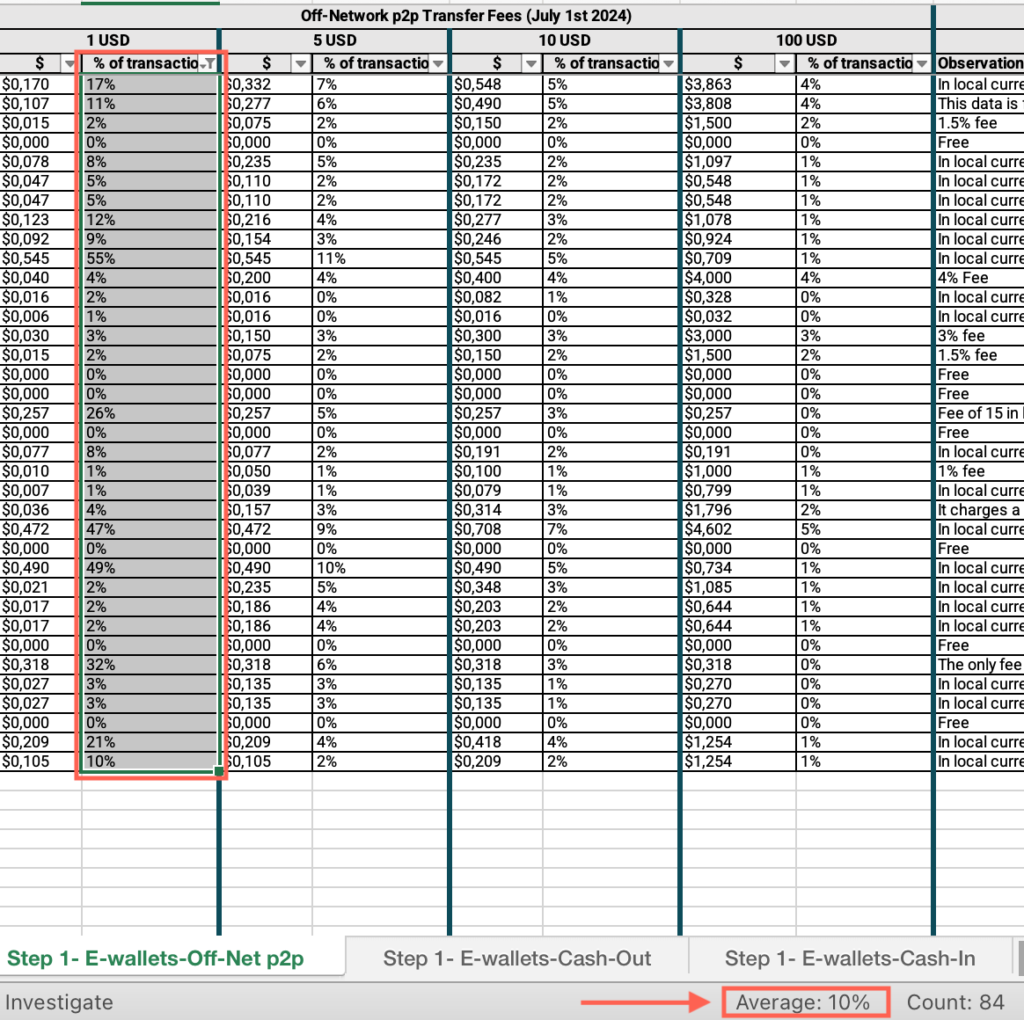
- Repeat these steps for 5 USD, 10 USD and 100 USD.
Step 1: What are the fees for withdrawing (cash-out) 1/5/10/100 USD from e-wallets in USD and as a percentage of the transaction amount?
- In the M2-How to carry out a price analysis-databases Excel file, open the “Step 1- E-wallets-Cash-Out” sheet.
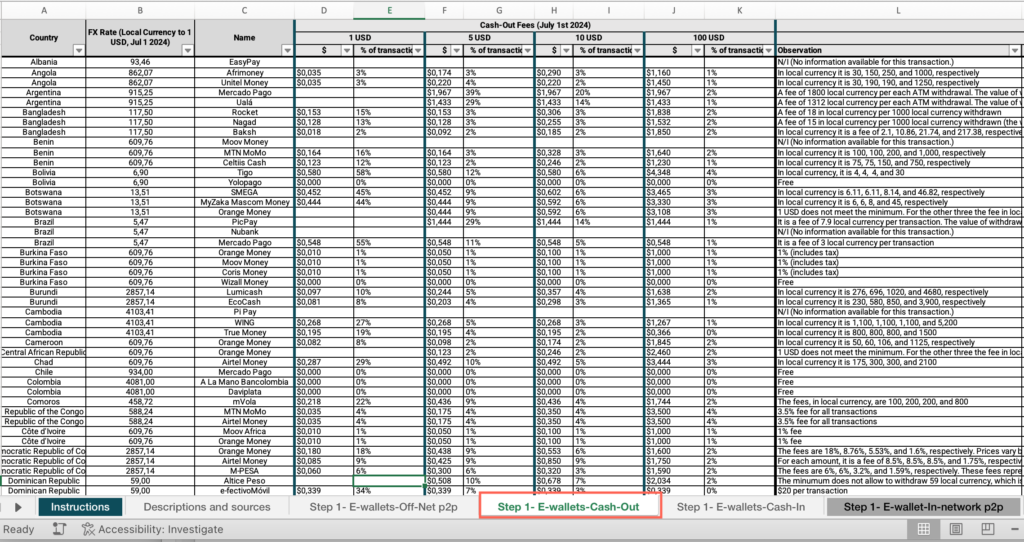
- Locate the “Country” column > Apply the filter > Uncheck “Select all” > Filter by your country.
- Under the “Cash-Out Fees (July 1st 2024)” cell, locate the “1 USD” cell > Find the “$” column > Find the value and answer the question on the platform.
- Repeat these steps for 5 USD, 10 USD and 100 USD.
- Under the “Cash-Out Fees (July 1st 2024)” cell, locate the “1 USD” cell > Find the “% of transaction” column > Find the value and answer the question on the platform.
- Repeat these steps for 5 USD, 10 USD and 100 USD.
Step 1: Are the fees for withdrawing (cash-out) 1/5/10/100 USD from e-wallets as a percentage of the transaction amount in your country higher than the average for all countries in the database?
- In the M2-How to carry out a price analysis-databases Excel file, open the “Step 1- E-wallets-Cash-Out” sheet.
- If you have applied the filter by your country, locate the “Country” column > Apply the filter > Check “Select all.”
- Locate the “1 USD” cell > Find the “% of transaction” column > Apply the filter > Uncheck “Blanks.”
- Click and drag to select the entire range of cells in the “% of transaction” column > Find the average at the bottom of the sheet and answer the question on the platform.
- Repeat these steps for 5 USD, 10 USD and 100 USD.
Step 1: What are the average fees (averaged across all e-wallets in your country) for depositing (cash-in) 1/5/10/100 USD in e-wallets in your country?
- In the M2-How to carry out a price analysis-databases Excel file, open the “Step 1- E-wallets-Cash-In” sheet.
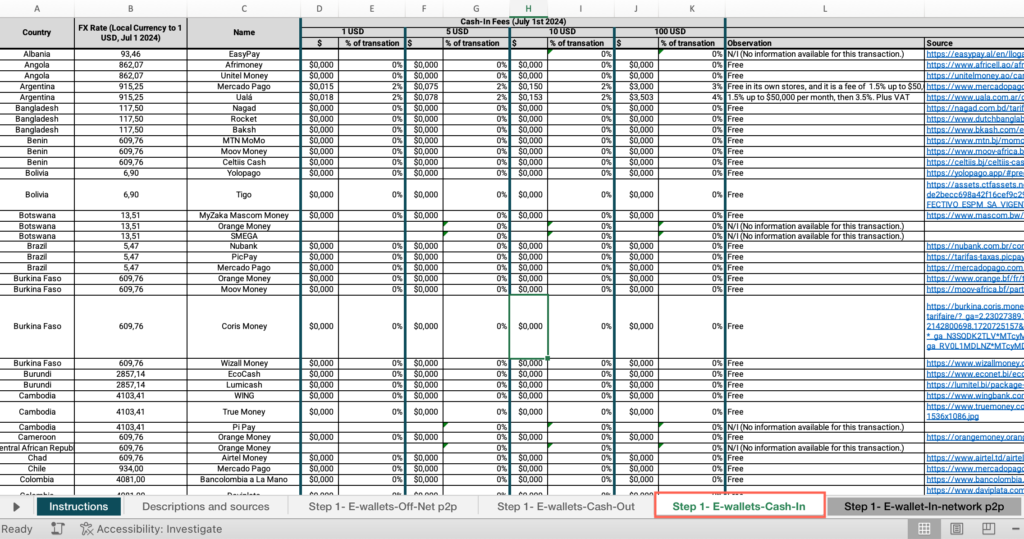
- Locate the “Country” column > Apply the filter > Uncheck “Select all” > Filter by your country.
- Under the “Cash-In Fees (July 1st 2024)” cell, locate the “1 USD” cell > Find the “$” column > Find the value and answer the question on the platform.
- Repeat these steps for 5 USD, 10 USD and 100 USD.
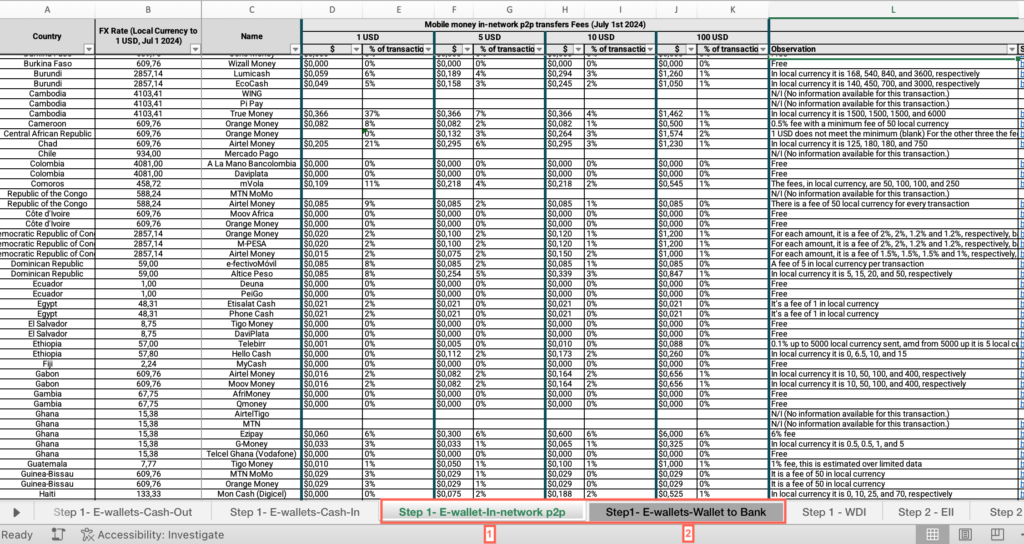
Step 1: Optional Exploration
- Repeat the previous steps to find the average fees for transferring funds in-network (peer-to-peer transfers), using the “Step 1- E-wallet-In-network p2p” sheet, and for transferring funds from an e-wallet to a bank account, using the “Step1- E-wallets-Wallet to Bank” sheet.
Step 1: When compared with the global average, are the costs of sending remittances to your country much higher, higher, similar or lower?
- In the M2-How to carry out a price analysis-databases Excel file, open the “Step 1- WDI” sheet.
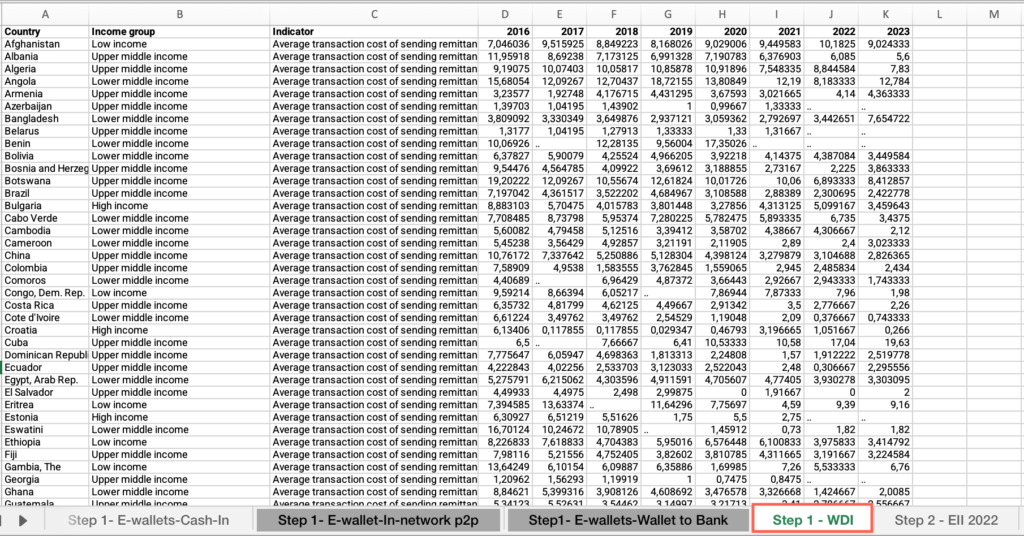
- Locate the “Country ” column > Apply the filter > Uncheck “Select all” > Filter by your country.
- Locate the “Indicator” column > Move across columns to find the most recent year with available data > Find the value.
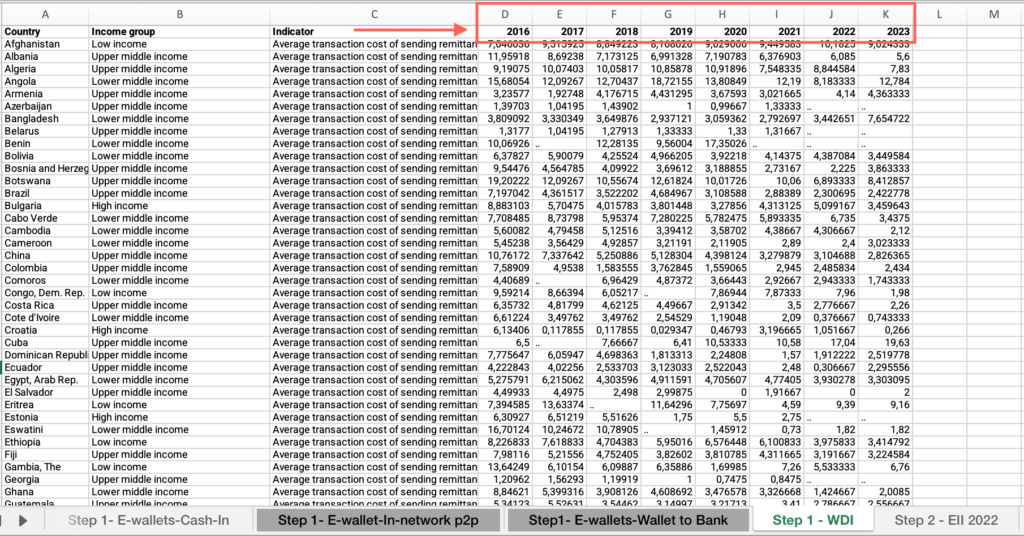
- Locate the “Country” column > Apply the filer > Check “Select all.”
- Move across columns to find the most recent year with available data > Apply the filter > Click and drag to select the entire range of cells in this column > Find the average at the bottom of the sheet, compare it with your country’s score and answer the question on the platform.
Step 1: How do the costs of sending remittances to your country compare against your income-level group?
- In the M2-How to carry out a price analysis-databases Excel file, open the “Step 1- WDI” sheet.
- If you have applied the filter by your country, locate the “Country” column > Apply the filter > Check “Select all.”
- Locate the “Income group” column > Filter by your income group.
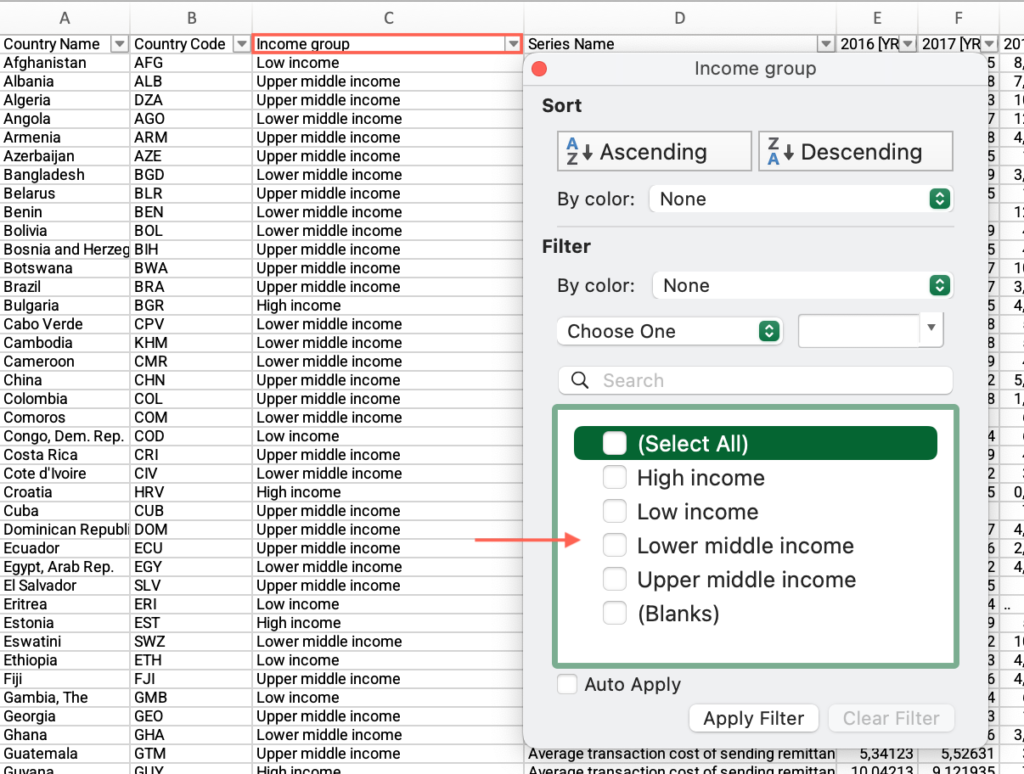
- Locate the “Indicator” column > Move across columns to find the most recent year with available data > Click and drag to select the entire range of cells in this column > Find the average at the bottom of the sheet, compare it with your country’s score and answer the question on the platform.
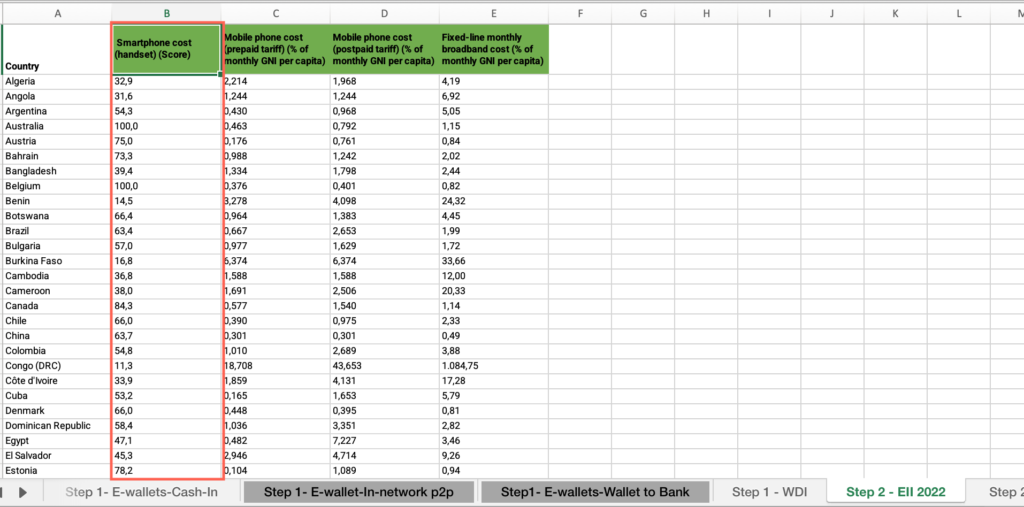
Step 2: What is your country’s score in the smartphone cost (handset) indicator?
- In the M2-How to carry out a price analysis-databases Excel file, open the “Step 2 – EII 2022” sheet.
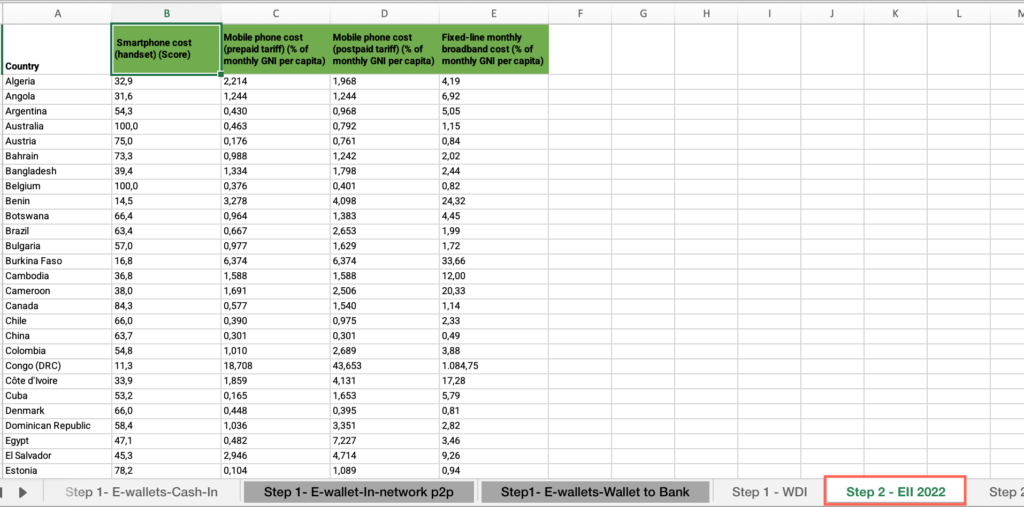
- Locate the “Country” column > Apply the filter > Uncheck “Select all” > Filter by your country.
- Under “Smartphone cost (handset) (Score” find the value for your country.
Step 2: What is the cost of owning a mobile phone (prepaid tariff) as a percentage of GNI per capita?
- In the M2-How to carry out a price analysis-databases Excel file, open the “Step 2 – EII 2022” sheet.
- Locate the “Mobile phone cost (prepaid tariff) (2022).” column > Find the value and answer the question on the platform”
Step 2: Is the cost of owning a mobile phone (prepaid tariff) higher than the world average?
- In the M2-How to carry out a price analysis-databases Excel file, open the “Step 2 – EII -MPprepaid average” sheet.
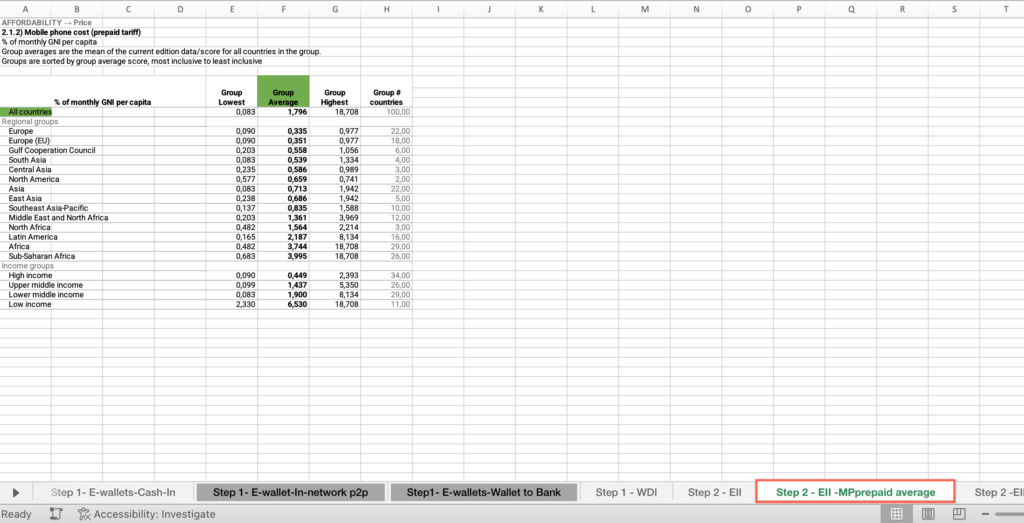
- Locate the “All countries” cell > Locate the “Group average” column > Find the value, compare it with your country’s score and answer the question on the platform.
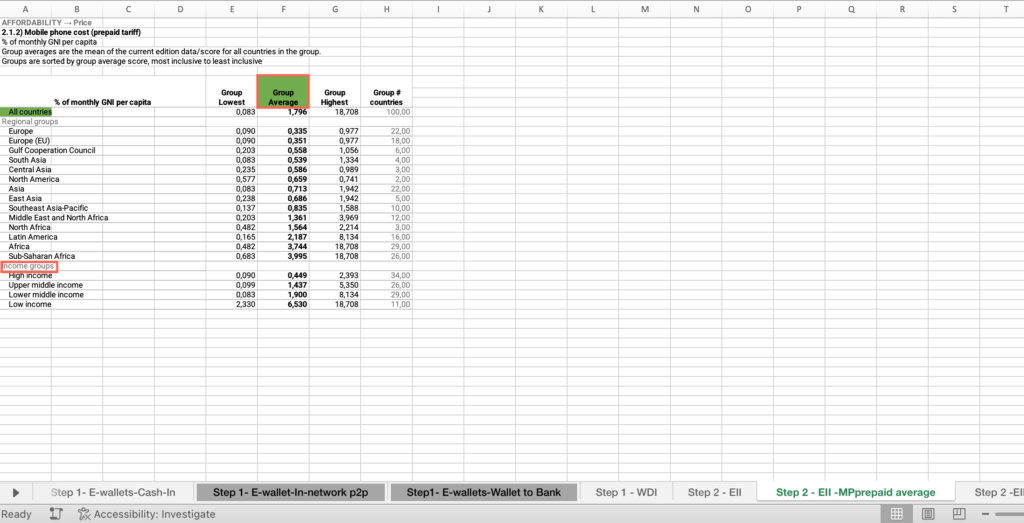
Step 2: Is the cost of owning a mobile phone (prepaid tariff) higher than the average for countries in your income group?
- In the M2-How to carry out a price analysis-databases Excel file, open the “Step 2 – EII -MPprepaid average” sheet.
- Locate the “Income groups” cell > Find your income group > Locate the “Group average” column > Find the value, compare it with your country’s score and answer the question on the platform.
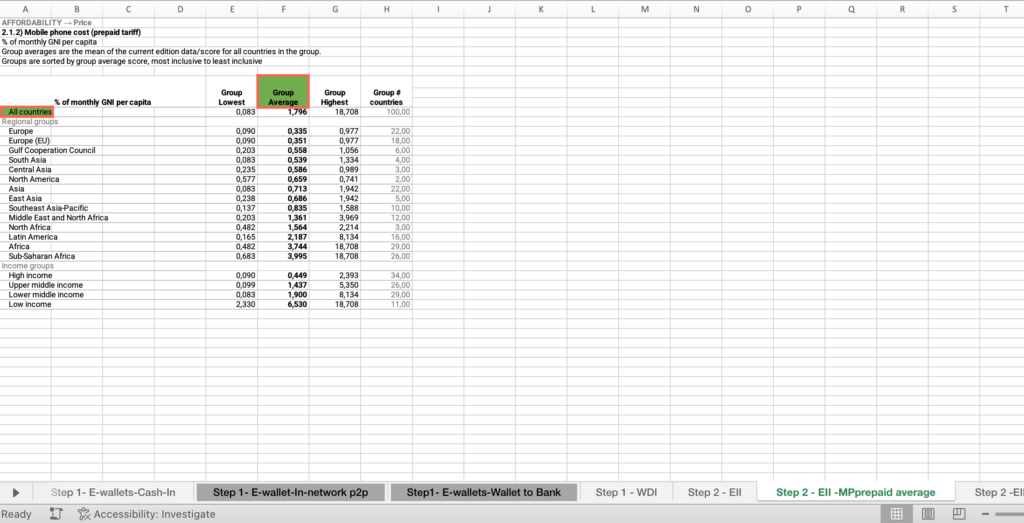
Step 2: Is the cost of owning a mobile phone (prepaid tariff) higher than the average for countries within the same geographic region?
- In the M2-How to carry out a price analysis-databases Excel file, open the “Step 2 – EII -MPprepaid average” sheet.
- Locate the “Regional groups” cell > Find your regional group > Locate the “Group average” column > Find the value, compare it with your country’s score and answer the question on the platform.

Step 2: What is the cost of owning a mobile phone (postpaid tariff) as a percentage of GNI per capita?
- In the M2-How to carry out a price analysis-databases Excel file, open the “Step 2 – EII 2022” sheet.
- Locate the Mobile phone cost (postpaid tariff) (2022).” column > Find the value and answer the question on the platform.
Step 2: Is the cost of owning a mobile phone (postpaid tariff) higher than the world average?
- In the M2-How to carry out a price analysis-databases Excel file, open the “Step 2 – EII -MPpostpaid average” sheet.
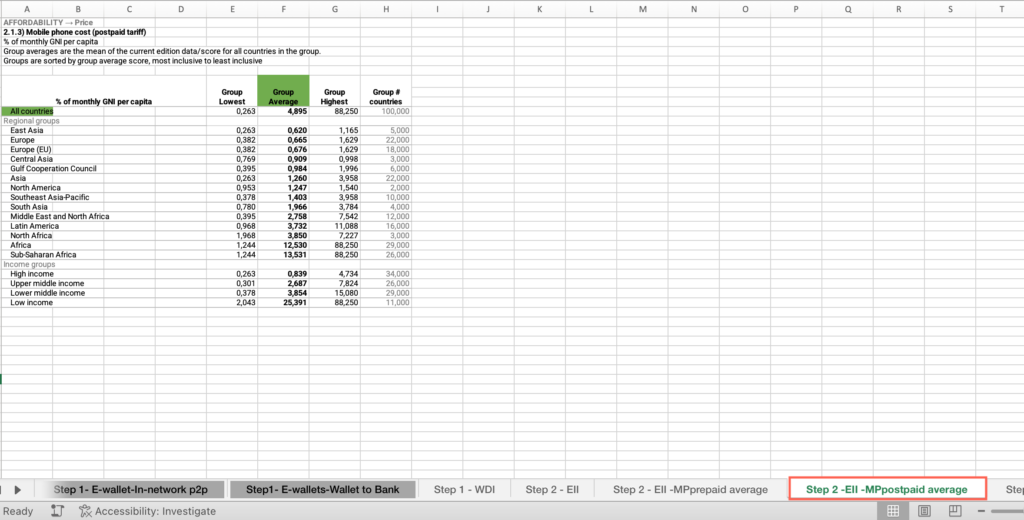
- Locate the “All countries” cell > Locate the “Group average” column > Find the value, compare it with your country’s score and answer the question on the platform.
Step 2: Is the cost of owning a mobile phone (postpaid tariff) higher than the average for countries in your income group?
- In the M2-How to carry out a price analysis-databases Excel file, open the “Step 2 – EII -MPpostpaid average” sheet.
- Locate the “Income groups” cell > Find your income group > Locate the “Group average” column > Find the value, compare it with your country’s score and answer the question on the platform.
Step 2: Is the cost of owning a mobile phone (postpaid tariff) higher than the average for countries within the same geographic region?
- In the M2-How to carry out a price analysis-databases Excel file, open the “Step 2 – EII -MPpostpaid average” sheet.
- Locate the “Regional groups” cell > Find your regional group > Locate the “Group average” column > Find the value, compare it with your country’s score and answer the question on the platform.
Step 2: What is the cost of a monthly fixed-line broadband as a percentage of GNI per capita?
- In the M2-How to carry out a price analysis-databases Excel file, open the “Step 2 – EII 2022” sheet.
- Locate the “Fixed-line monthly broadband cost.” column > Find the value and answer the question on the platform.
Step 2: Is the cost of a monthly fixed-line broadband higher than the world average?
- In the M2-How to carry out a price analysis-databases Excel file, open the “Step 2 – EII -Fixed-line average” sheet.
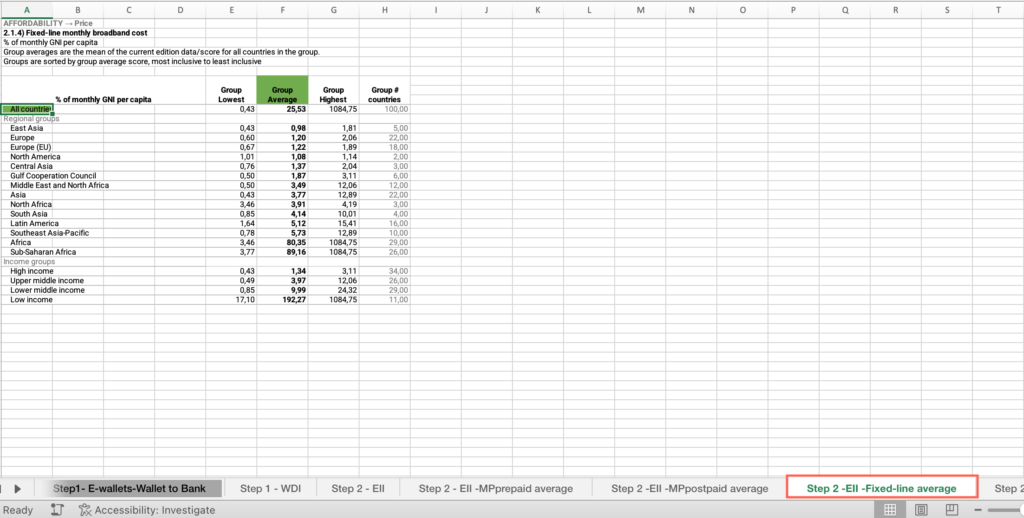
- Locate the “All countries” cell > Locate the “Group average” column > Find the value, compare it with your country’s score and answer the question on the platform.
Step 2: Is the cost of a monthly fixed-line broadband higher than the average for countries in your income group?
- In the M2-How to carry out a price analysis-databases Excel file, open the “Step 2 – EII -Fixed-line average” sheet.
- Locate the “Income groups” cell > Find your income group > Locate the “Group average” column > Find the value, compare it with your country’s score and answer the question on the platform.
Step 2: Is the cost of a monthly fixed-line broadband higher than the average for countries within the same geographic region?
- In the M2-How to carry out a price analysis-databases Excel file, open the “Step 2 – EII -Fixed-line average” sheet.
- Locate the “Regional groups” cell > Find your regional group > Locate the “Group average” column > Find the value, compare it with your country’s score and answer the question on the platform.
Step 2: What is the price of 1GB of mobile data in USD?
- In the M2-How to carry out a price analysis-databases Excel file, open the “Step 2- Cableco-1GB 2023” sheet.
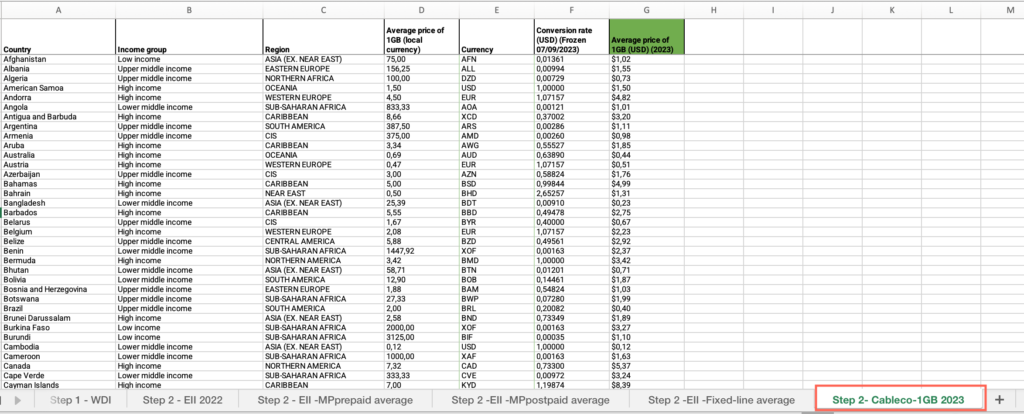
- Locate the “Country” column > Apply the filter > Uncheck “Select all” > Filter by your country.
- Locate the “Average price of 1GB (USD)” column > Find the value and answer the question on the platform.
Step 2: Is the cost of 1GB of mobile data in USD higher than the world average?
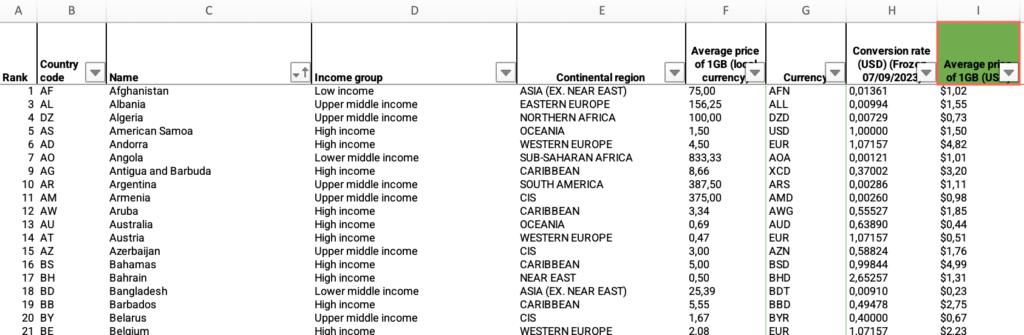
- In the M2-How to carry out a price analysis-databases Excel file, open the “Step 2- Cableco-1GB 2023” sheet.
- If you have applied the filter by your country, locate the “Country” column > Apply the filter > Check “Select all”.
- Locate the “Average price of 1GB (USD)” column > Click and drag to select the entire range of cells in the column > Find the average at the bottom of the sheet, compare it with your country’s score and answer the question on the platform.
Step 2: Is the cost of 1GB of mobile data in USD higher than the average for countries in your income group?
- In the M2-How to carry out a price analysis-databases Excel file, open the “Step 2- Cableco-1GB 2023” sheet.
- If you have applied the filter by your country, locate the “Country” column > Apply the filter > Check “Select all”.
- Locate the “Income Group” column > Filter by your country’s income group.
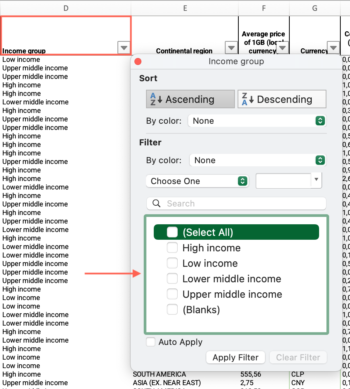
- Locate the “Average price of 1GB (USD)” column > Click and drag to select the entire range of cells in the column > Find the average at the bottom of the sheet, compare it with your country’s score and answer the question on the platform.
Step 2: Is the cost of 1GB of mobile data in USD higher than the average for countries within the same geographic region?
- In the M2-How to carry out a price analysis-databases Excel file, open the “Step 2- Cableco-1GB 2023” sheet.
- If you have applied the filter by your country, locate the “Country” column > Apply the filter > Check “Select all”.
- Locate the “Region” column > Filter by your country’s regional group.
- Locate the “Average price of 1GB (USD)” column > Click and drag to select the entire range of cells in the column > Find the average at the bottom of the sheet, compare it with your country’s score and answer the question on the platform.