Module 6 Assignment – Excel Tutorials
The following tutorial is an optional resource meant to assist you in navigating the databases and collecting the necessary data for your analysis.
Note on recording your responses: In the assignment you will find all the necessary fields to record your answers and the data you collect. You will also find an optional Answer Sheet Excel file to keep record of the collected data and your findings. You will find this file in the assignment’s introduction.
Step 1: Does your country score less than -1 in at least one of the six WGI indicators?
- Open the M6 – Step-by-step guide to analyze institutional quality – databases Excel file, open the “Step 1 – WGI” sheet.
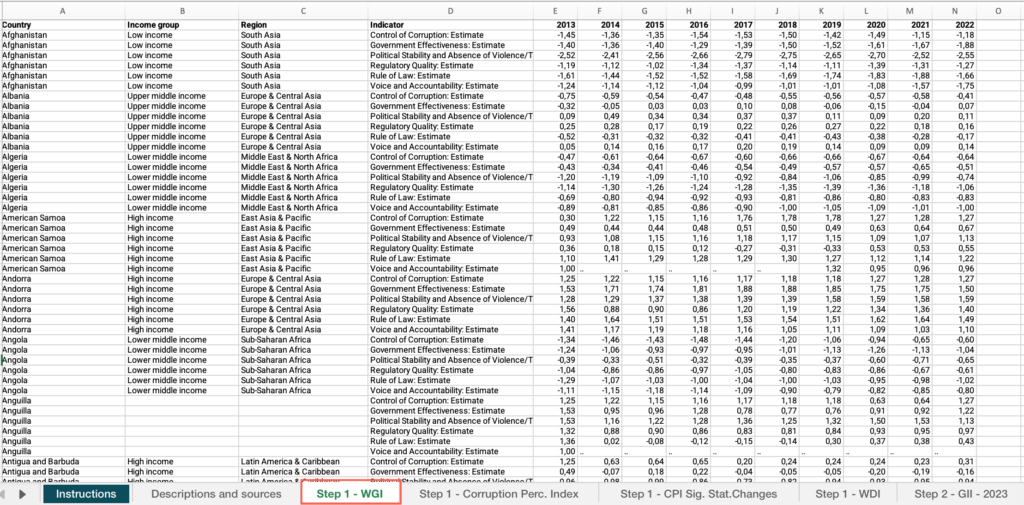
- Right-click on the status bar at the bottom of the Excel window. In the dialog box that appears, ensure that the checkbox for “Average” is checked.
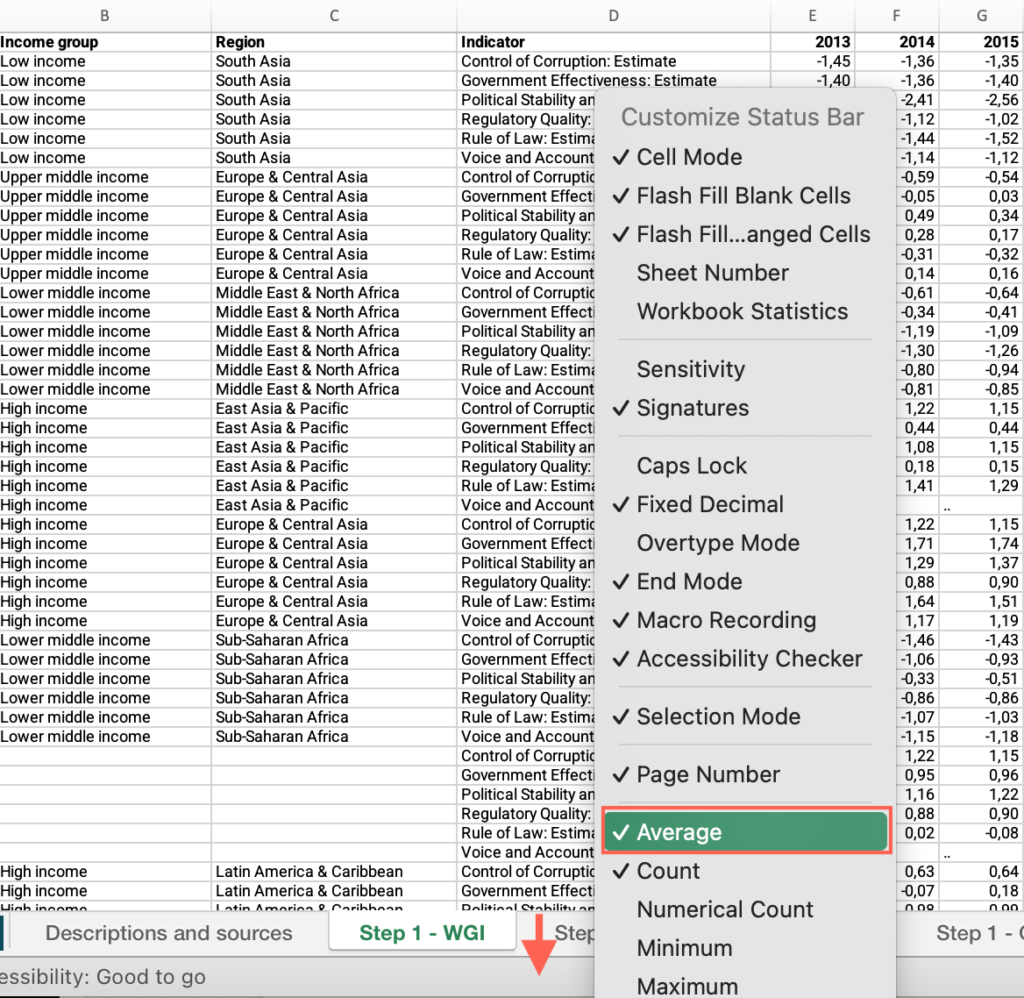
- Select the header row > Click the Data menu > Select “Filter”.
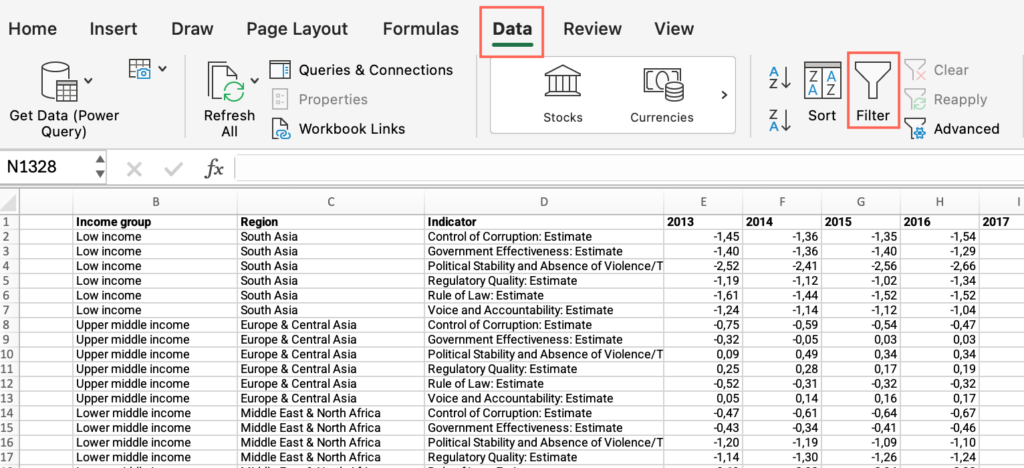
- Now that “Filter” is enabled, click on the dropdown arrow in the “Country” column header > Uncheck “Select All” > Check the box for your country.
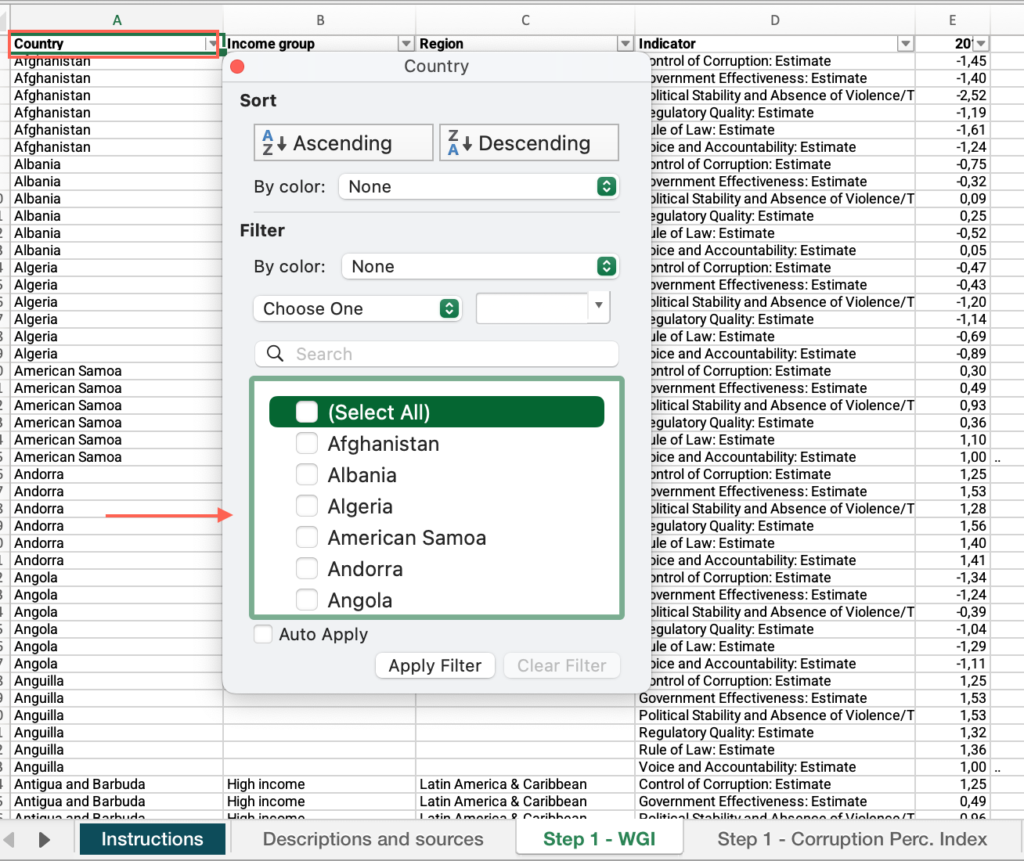
- Locate the “Indicator” column > Find your country’s values for each indicator for the most recent year > Answer the question on the platform.

Step 1: Has your country’s performance worsened over the last five years in any of the identified weak indicators?
- In the “Step 1 – WGI” sheet, filter by the weak indicators > Move across columns to find the values for the last five years > Answer the question on the platform.
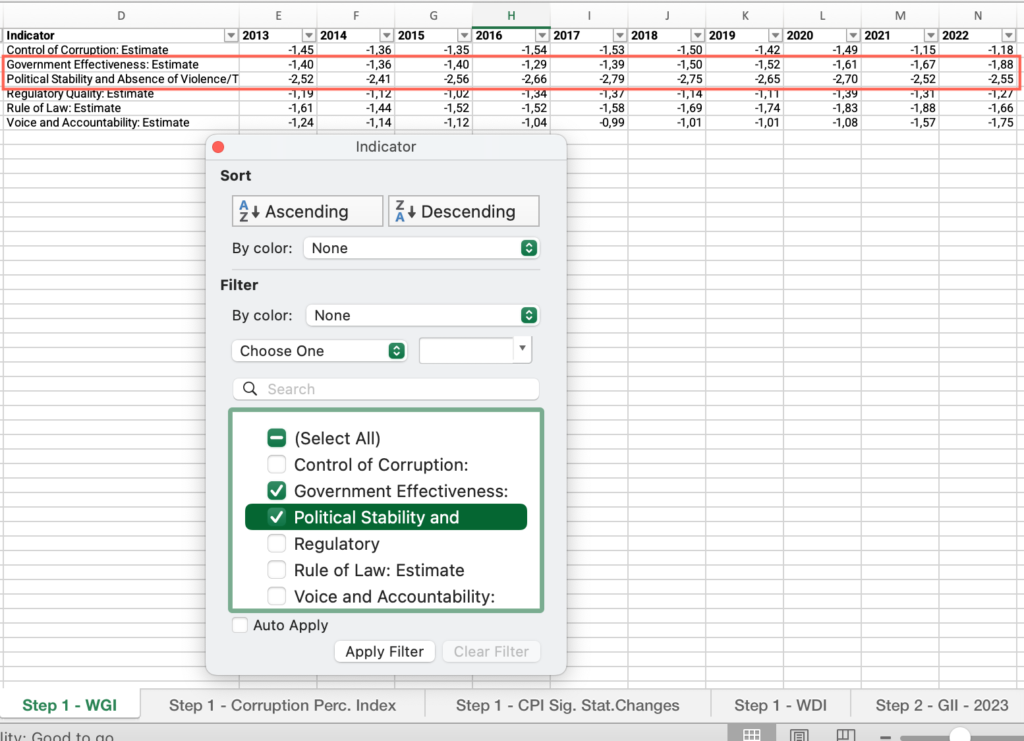
Step 1: Is your country’s score below the income group average in any of the following indicators?
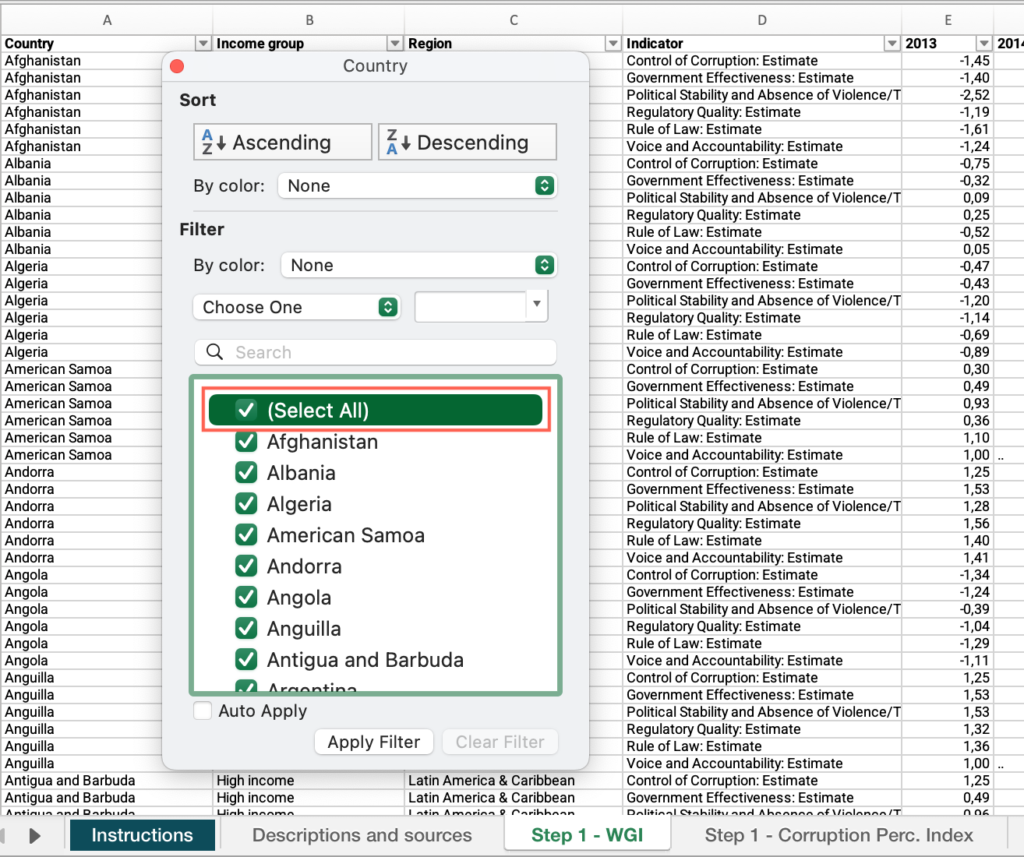
- In the “Step 1 – WGI” sheet, locate the “Country” column > Apply the filter > Check “Select all.”
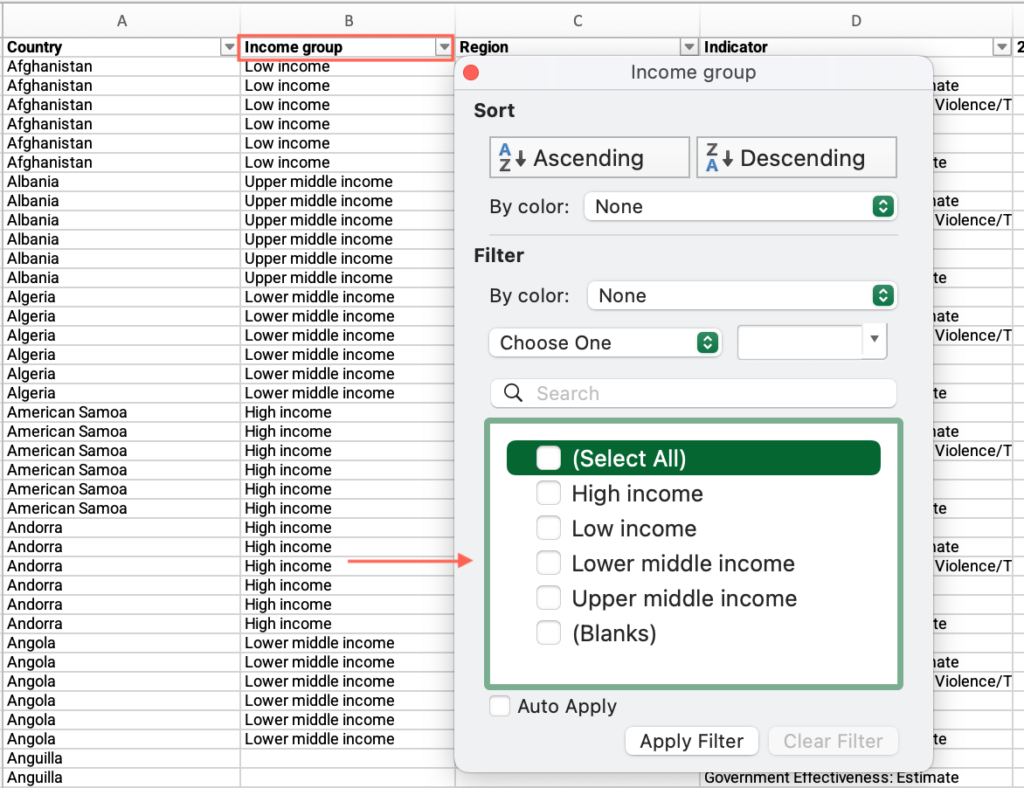
- Locate the “Income group” column > Filter by your income group.
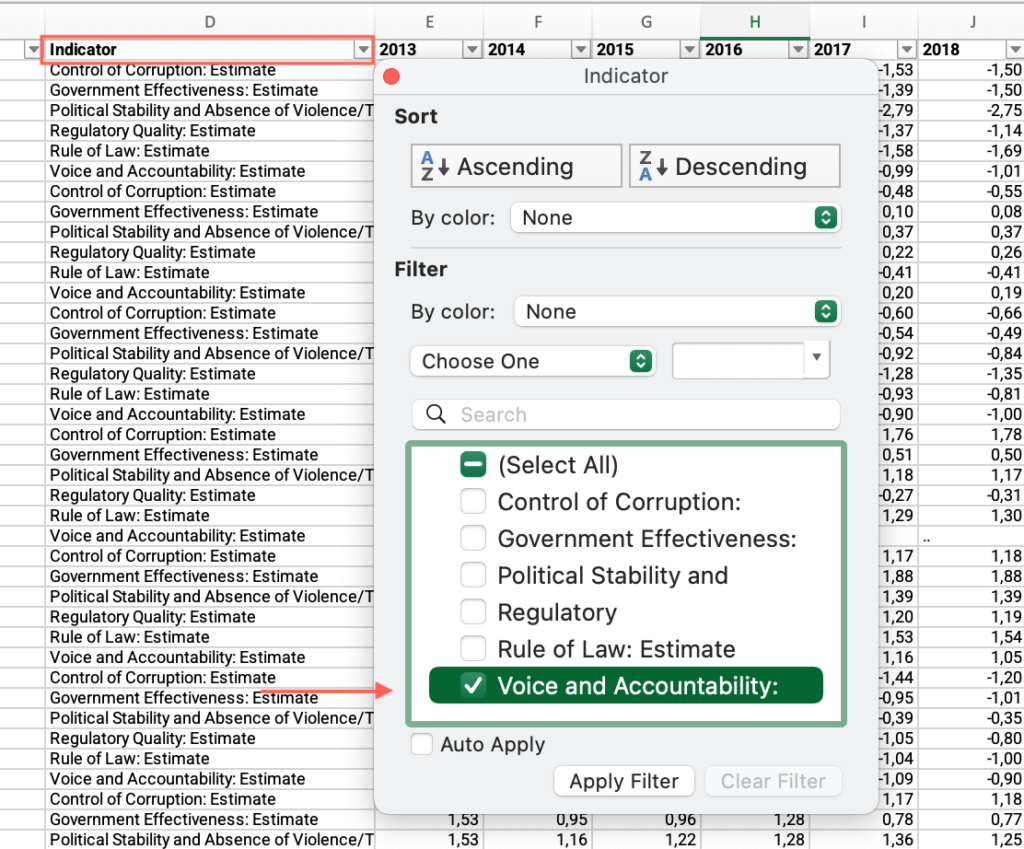
- Locate the “Indicator” column > Filter by “Voice and accountability”.
- Move across columns to find the most recent year with available data for your country > Apply the Filter > Uncheck “Blanks”.
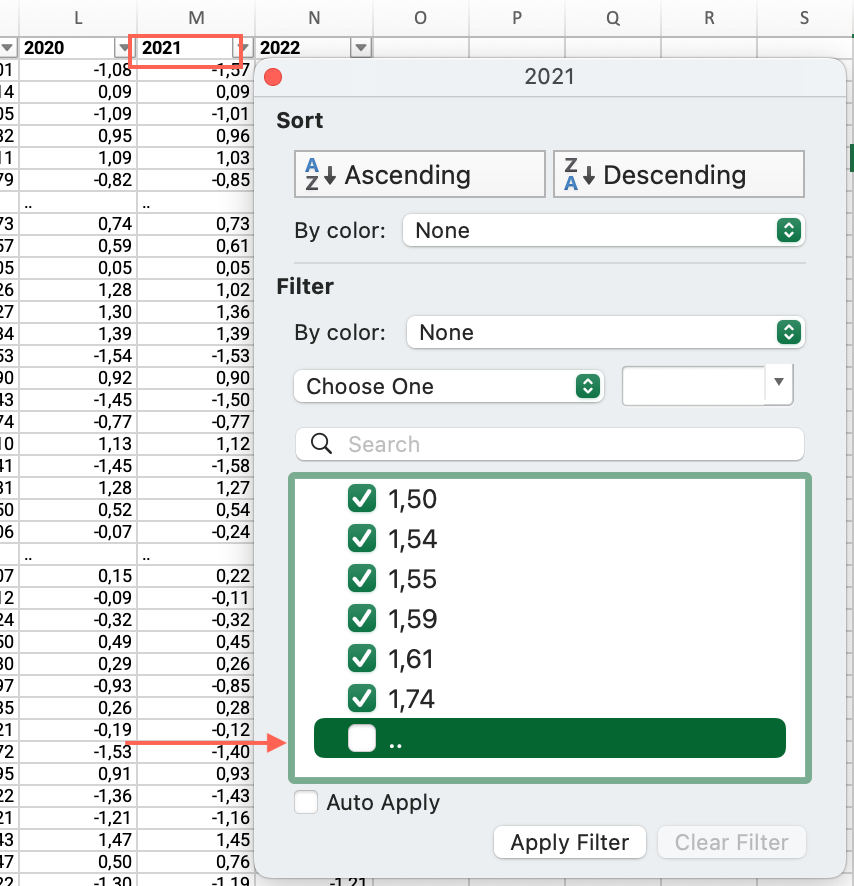
- Click and drag to select the entire range of cells in this column > Find the average at the bottom of the sheet, compare it with your country’s value and answer the question on the platform.
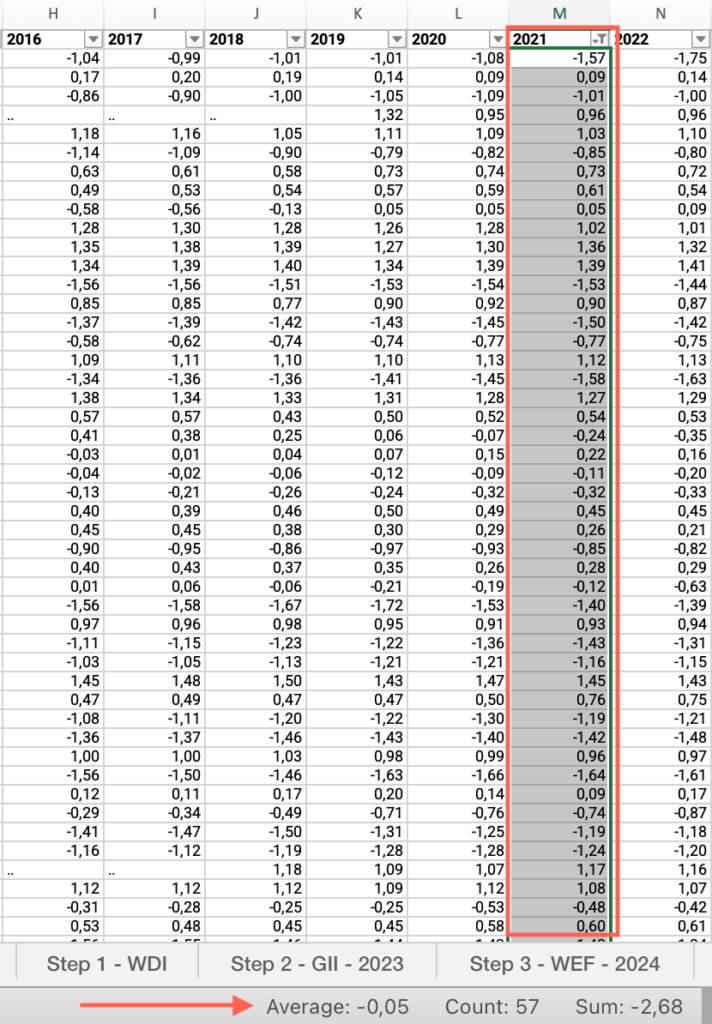
- Repeat these steps for the remaining 5 indicators.
Step 1: Is your country’s score below the regional group average in any of the following indicators?
- In the “Step 1 – WGI” sheet, locate the “Country” column > Apply the filter > Check “Select all.”
- Locate the “Region” column > Filter by your regional group.
- Locate the “Indicator” column > Filter by “Voice and accountability”.
- Move across columns to find the most recent year with available data for your country > Apply the Filter > Uncheck “Blanks”.
- Click and drag to select the entire range of cells in this column > Find the average at the bottom of the sheet, compare it with your country’s value and answer the question on the platform.
- Repeat these steps for the remaining 5 indicators.
Step 1: Is the income-level comparison result for your country consistent over time?
- In the “Step 1 – WGI” sheet, locate the “Country” column > Apply the filter > Check “Select all.”
- Locate the “Income” column > Filter by your income group.
- Locate the “Indicator” column > Filter by “Voice and accountability”.
- Move across columns to find the last five years with available data for your country > Select the earliest year in the range > Apply the Filter > Uncheck “Blanks”.
- Click and drag to select the entire range of cells in this column > Find the average at the bottom of the sheet.
- Repeat these steps for the remaining years and indicators.
Step 1: Is the regional comparison result for your country consistent over time?
- In the “Step 1 – WGI” sheet, locate the “Country” column > Apply the filter > Check “Select all.”
- Locate the “Region” column > Filter by your regional group.
- Locate the “Indicator” column > Filter by “Voice and accountability”.
- Move across columns to find the last five years with available data for your country > Select the earliest year in the range > Apply the Filter > Uncheck “Blanks”.
- Click and drag to select the entire range of cells in this column > Find the average at the bottom of the sheet
- Repeat these steps for the remaining years and indicators.
Step 1: Does your country score below the average of countries in the same income group?
- Open the “Step 1 – Corruption Perc. Index” sheet > Locate the “Country” column > Filter by your country.
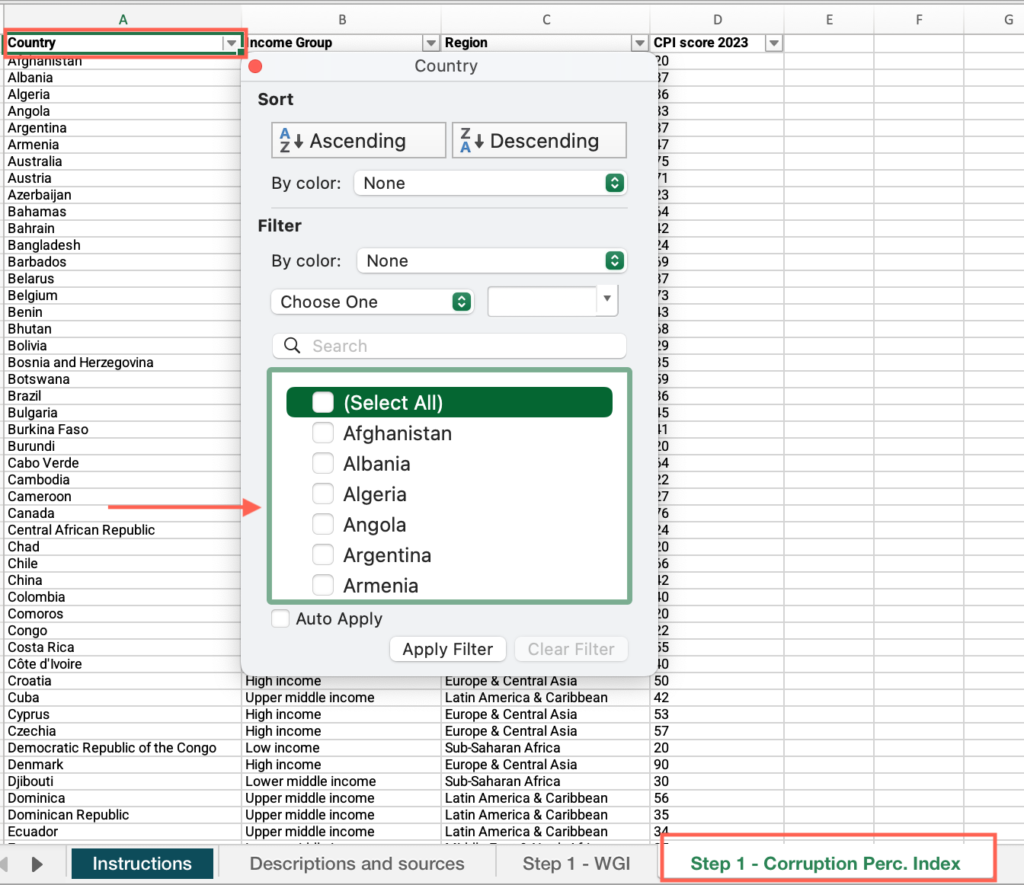
- Locate the “CPI score 2023” column > Find the value for your country.
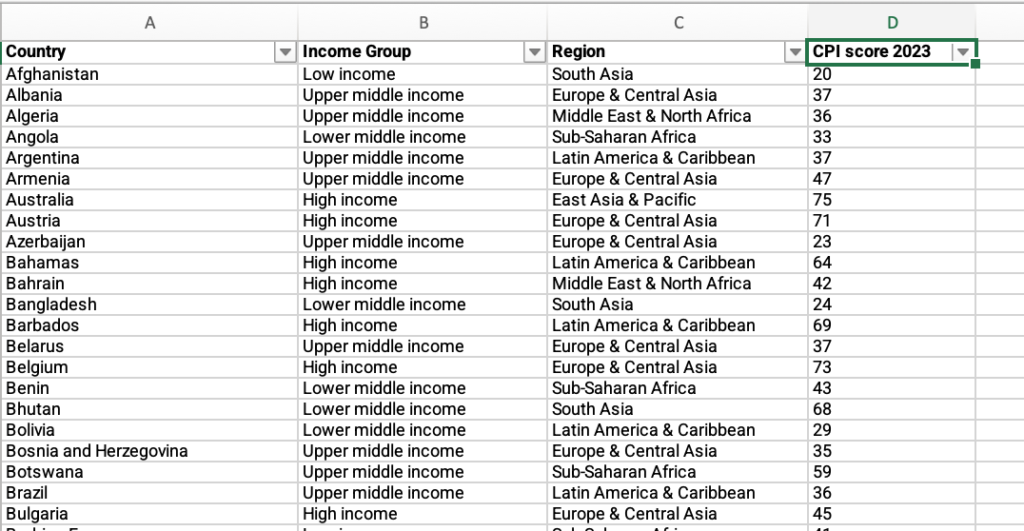
- Locate the “Country” column > Apply the filter > Check “Select all.”
- Locate the “Income group” column > Filter by your income group.
- Locate the “CPI score 2023” column > Click and drag to select the entire range of cells in this column > Find the average at the bottom of the sheet, compare it with your country’s value and answer the question on the platform.
Step 1: Did your country rank better or worse in 2023 than in 2012 on the Corruption Perceptions Index?
- Open the “Step 1 – CPI Sig. Stat.Changes” sheet > Locate the “Country” column > If your country is listed, check the box for your country.
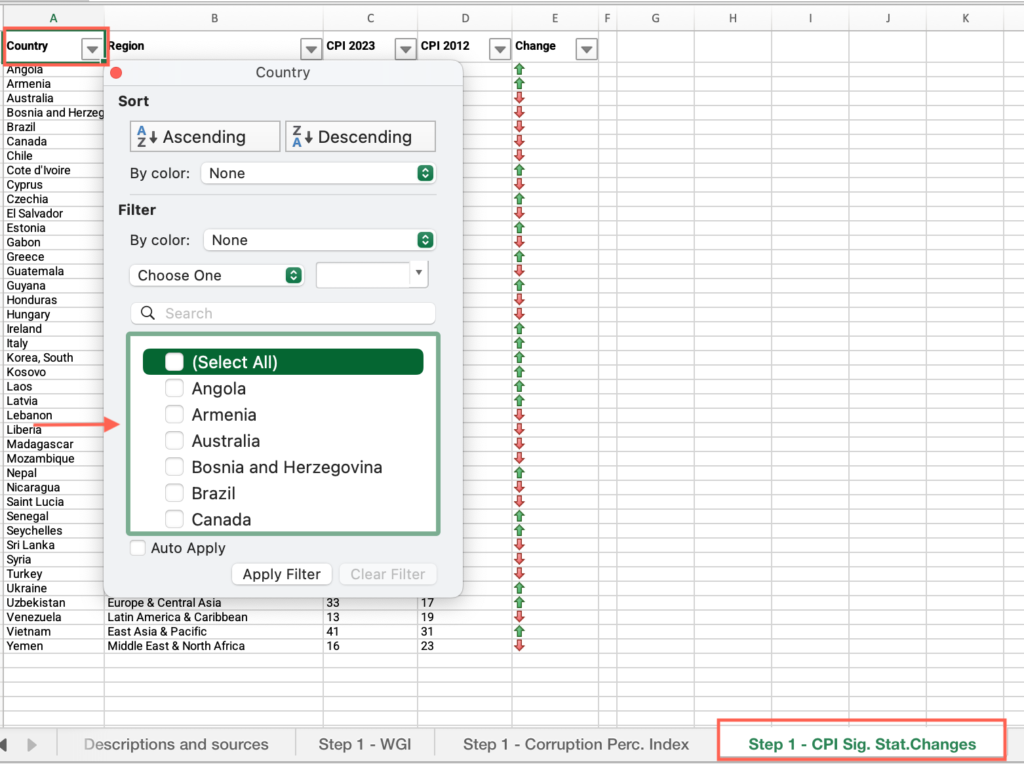
- Locate the “Change” column > Find the value for your country and answer the question on the platform.
Step 1: Has your country’s government spent within 85% to 115% of its planned budget at least twice in the most recent three years?
- Open the “Step 1 – WDI” sheet > Locate the “Country” column > Filter by your country.
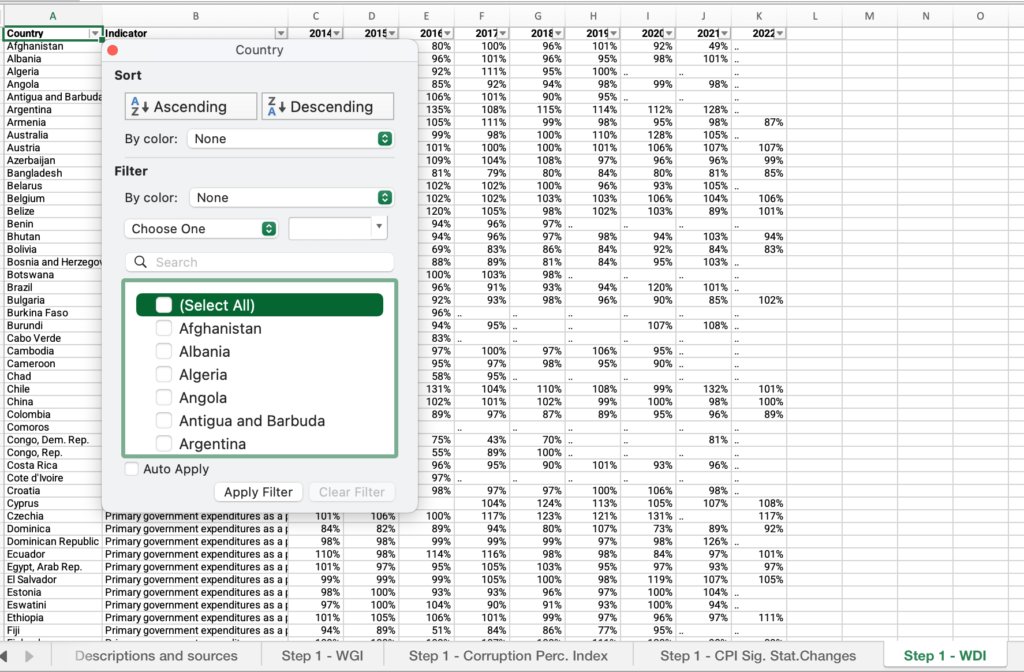
- Move across columns to find the values for the most recent three years > Answer the question on the platform.
Step 2: Has your country been classified as having either an overall strength or an overall weakness in the Business Environment indicator?
- Open the “Step 2 – GII – 2023” sheet > Locate the “Country” column > Filter by your country.
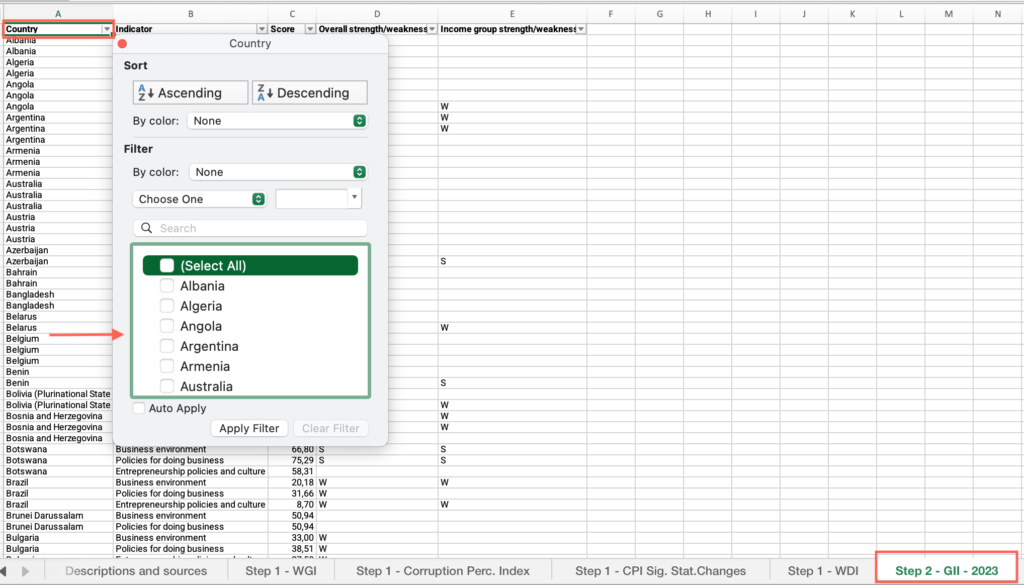
- Locate the “Indicator” column > Filter by “Business environment.”
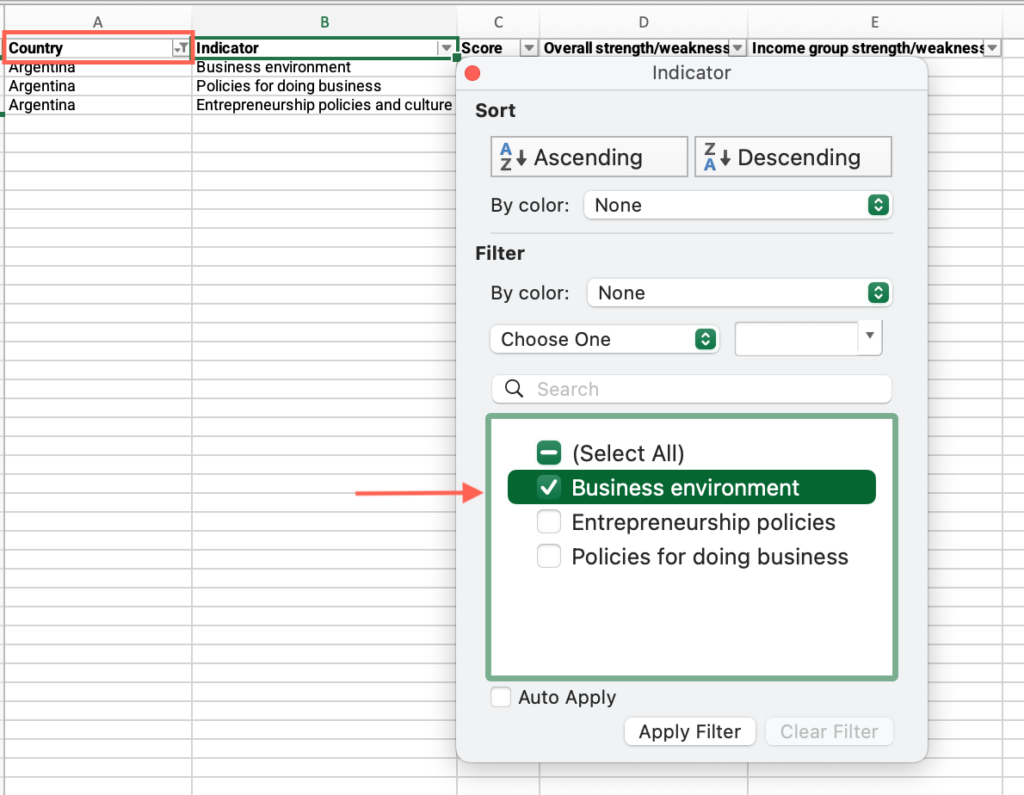
- Locate the “Overall strength/weakness” column > Find the value and answer the question on the platform.

- Repeat these steps for the remaining two indicators.
Step 2: Has your country been classified as having an income-group strength or weakness in the Business Environment indicator?
- Open the “Step 2 – GII – 2023” sheet > Locate the “Country” column > Filter by your country.
- Locate the “Indicator” column > Filter by “Business environment.”
- Locate the “Income strength/weakness” column > Find the value and answer the question on the platform.
- Repeat these steps for the remaining two indicators.
Step 3: Is your country’s score below the average of countries from the same income group?
- Open the “Step 3 – WEF – 2024” sheet > Locate the “Country” column > Filter by your country.
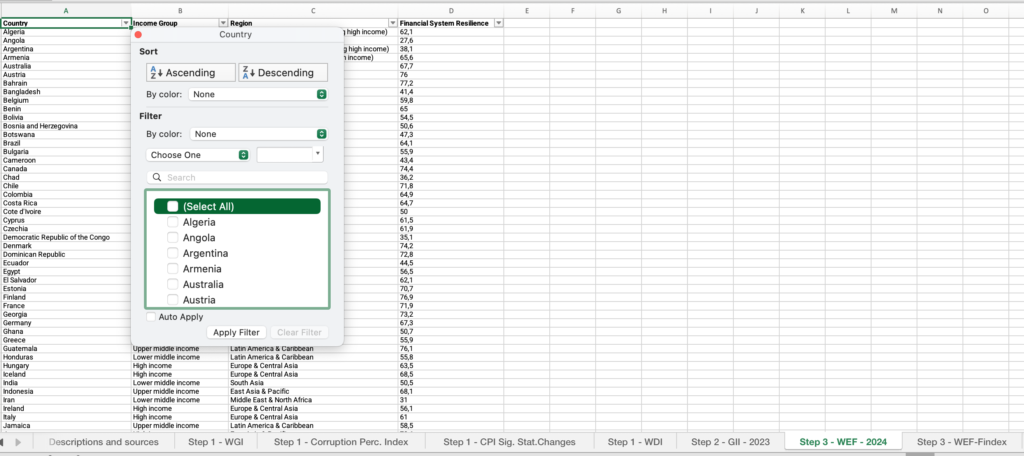
- Locate the “Financial system resilience” column > Find the value for your country.
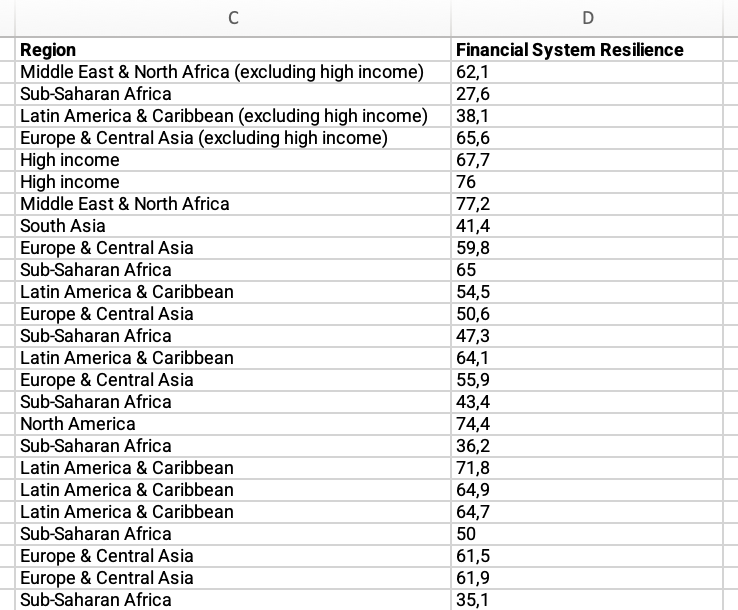
- Locate the “Country” column > Apply the filter > Check “Select all.”
- Locate the “Income group” column > Filter by your income group.
- Locate the “Financial system resilience” column > Click and drag to select the entire range of cells in this column > Find the average at the bottom of the sheet, compare it with your country’s value and answer the question on the platform.
Step 3: Is your country’s score below the average of countries from the same regional group?
- Open the “Step 3 – WEF – 2024” sheet > Locate the “Country” column > Filter by your country.
- Locate the “Country” column > Apply the filter > Check “Select all.”
- Locate the “Region” column > Filter by your regional group.
- Locate the “Financial system resilience” column > Click and drag to select the entire range of cells in this column > Find the average at the bottom of the sheet, compare it with your country’s value and answer the question on the platform.
Step 3: Does your country have low financial inclusion and low financial system resilience scores?
- Open the “Step 3 – WEF Findex” sheet > Locate the “Country” column > Filter by your country.
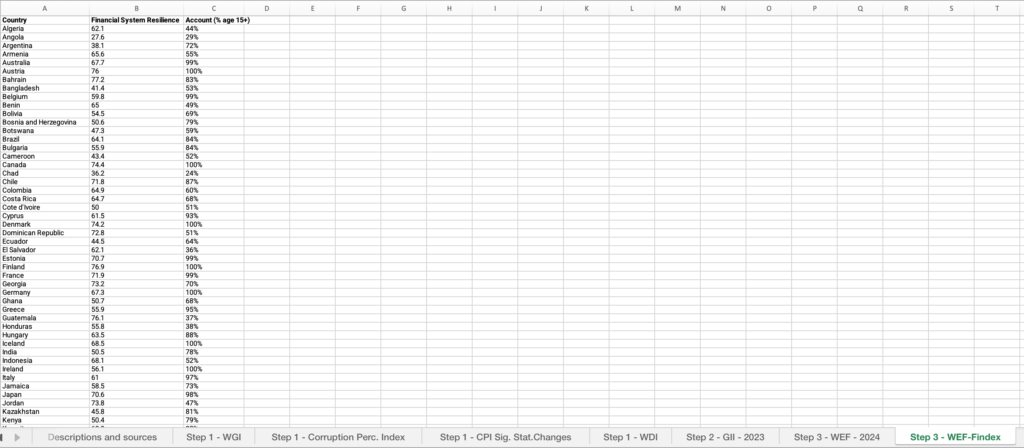
- Under the “Financial System Resilience” and “Account (% age 15+)” columns, find the values for your country and answer the question on the platform.
