Module 11 Assignment – Excel Tutorials
The following tutorial is an optional resource meant to assist you in navigating the databases and collecting the necessary data for your analysis.
Note on recording your responses: In the assignment you will find all the necessary fields to record your answers and the data you collect. You will also find an optional Answer Sheet Excel file to keep record of the collected data and your findings. You will find this file in the assignment’s introduction.
Step 1: Is the percentage of individuals without a financial account due to insufficient funds in your country higher than the average for non-high-income countries (low income, lower middle income, upper middle-income countries)?
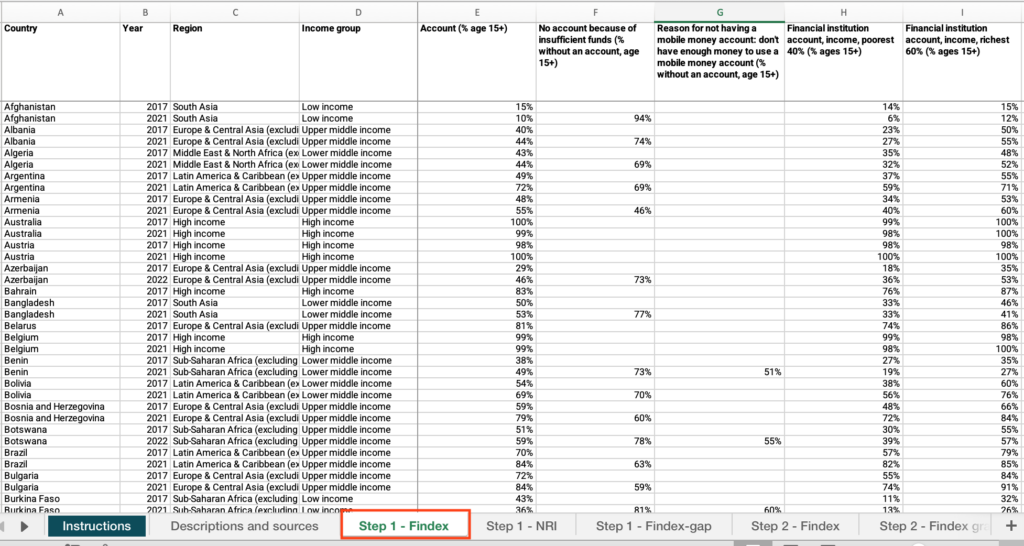
- Open the “M11 – Step-by-step guide to analyze low income and geography – databases.xlsx” file > Open the “Step 1 – Findex” sheet.
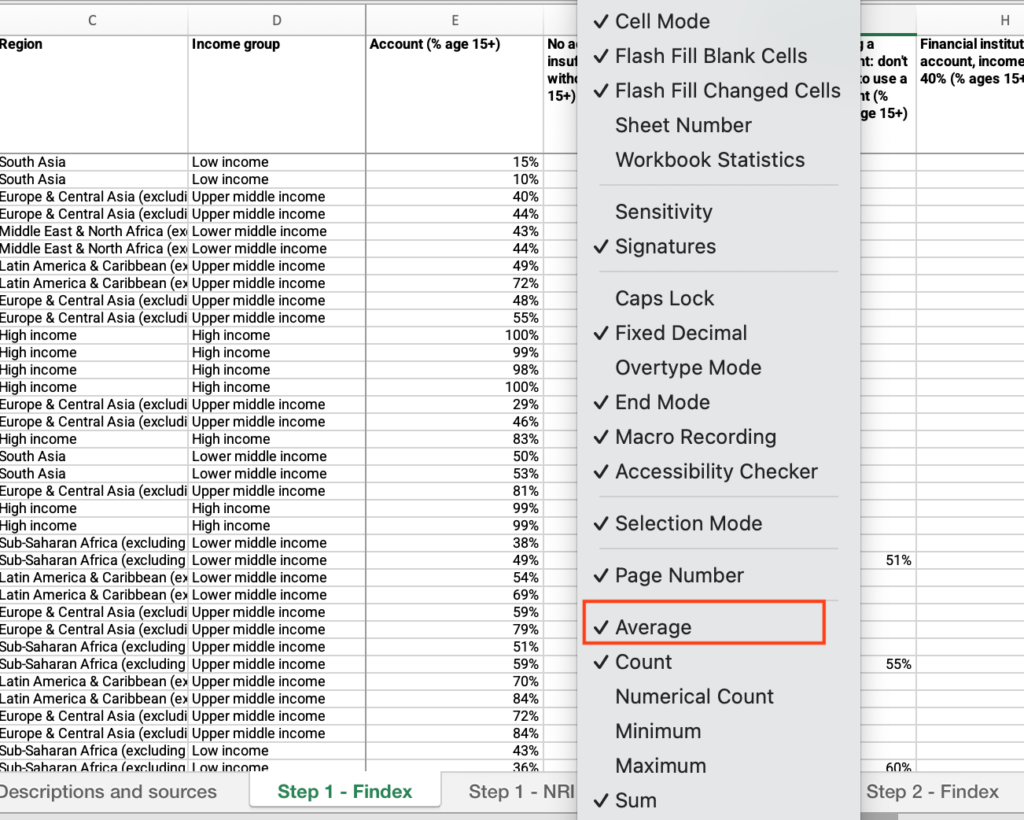
- Right-click on the status bar at the bottom of the Excel window > In the dialog box that appears, ensure that the checkbox for “Average” is checked.
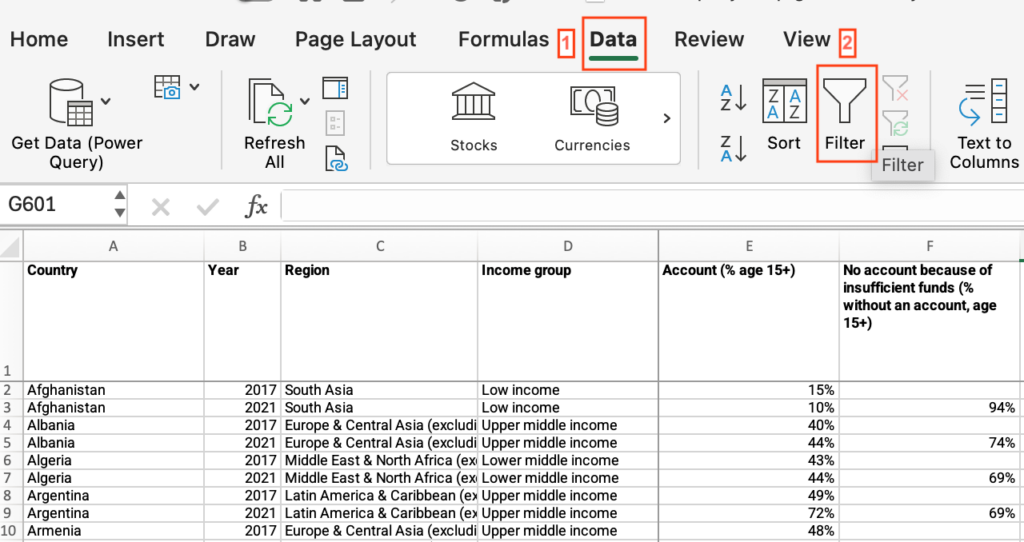
- Select the header row > click the Data menu > Select “Filter”.
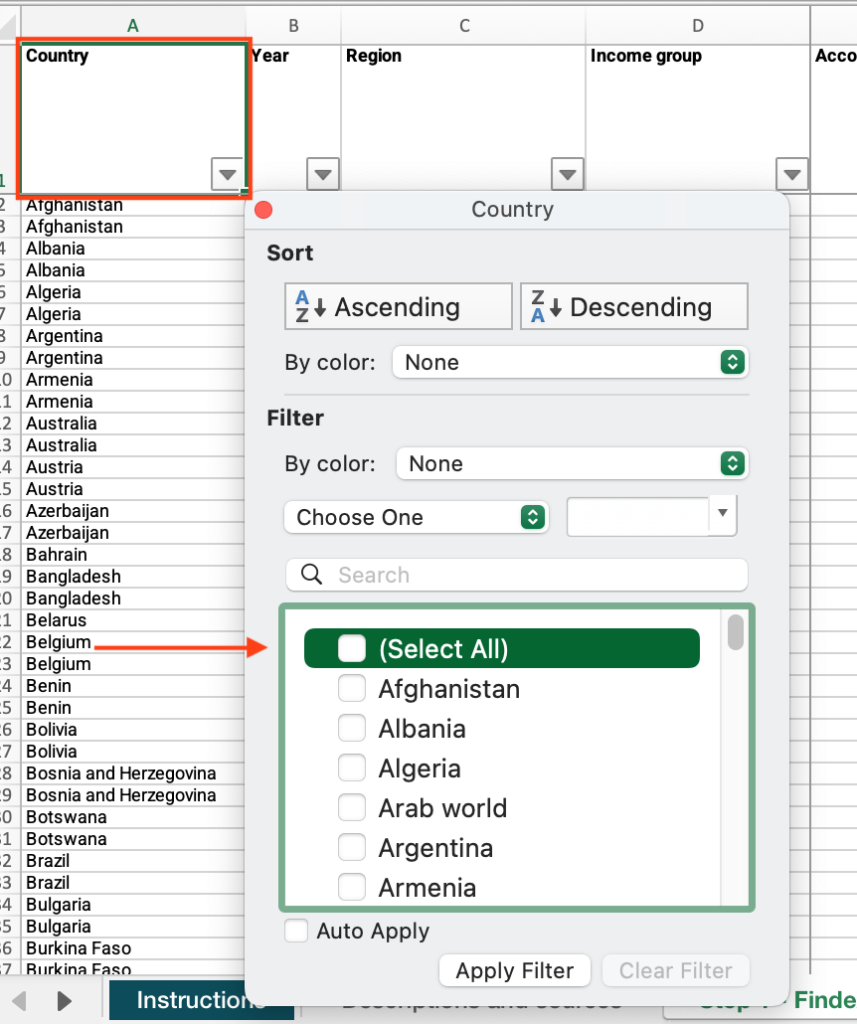
- Now that “Filter” is enabled, click on the dropdown arrow in the “Country” column header > Uncheck “Select All” > Check the box for your country.
- Locate the “No account because of insufficient funds (% without an account, age 15+)” column > Find the value.
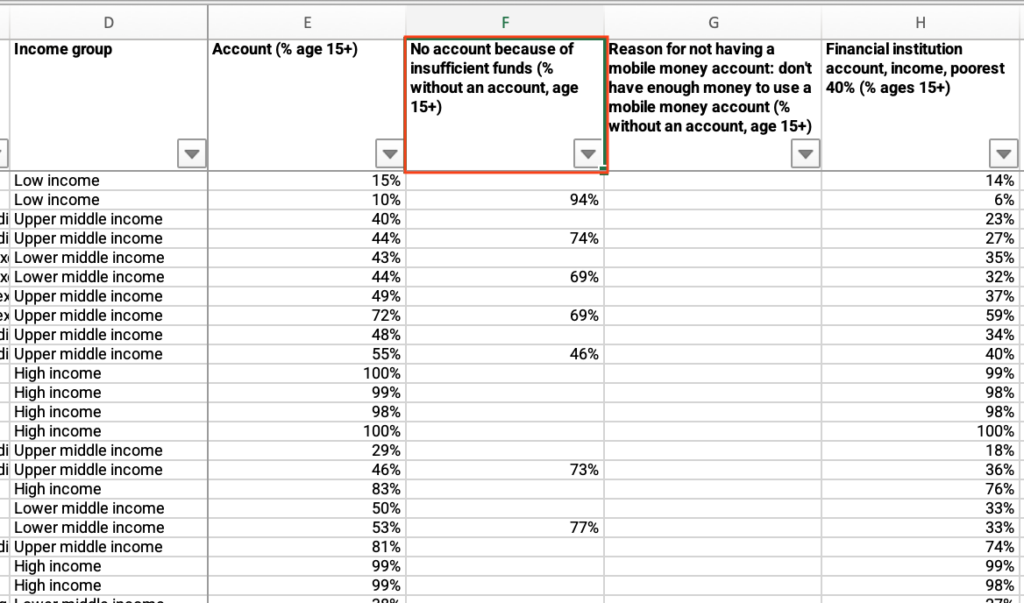
- Locate the “Country” column > Check “Select all.”
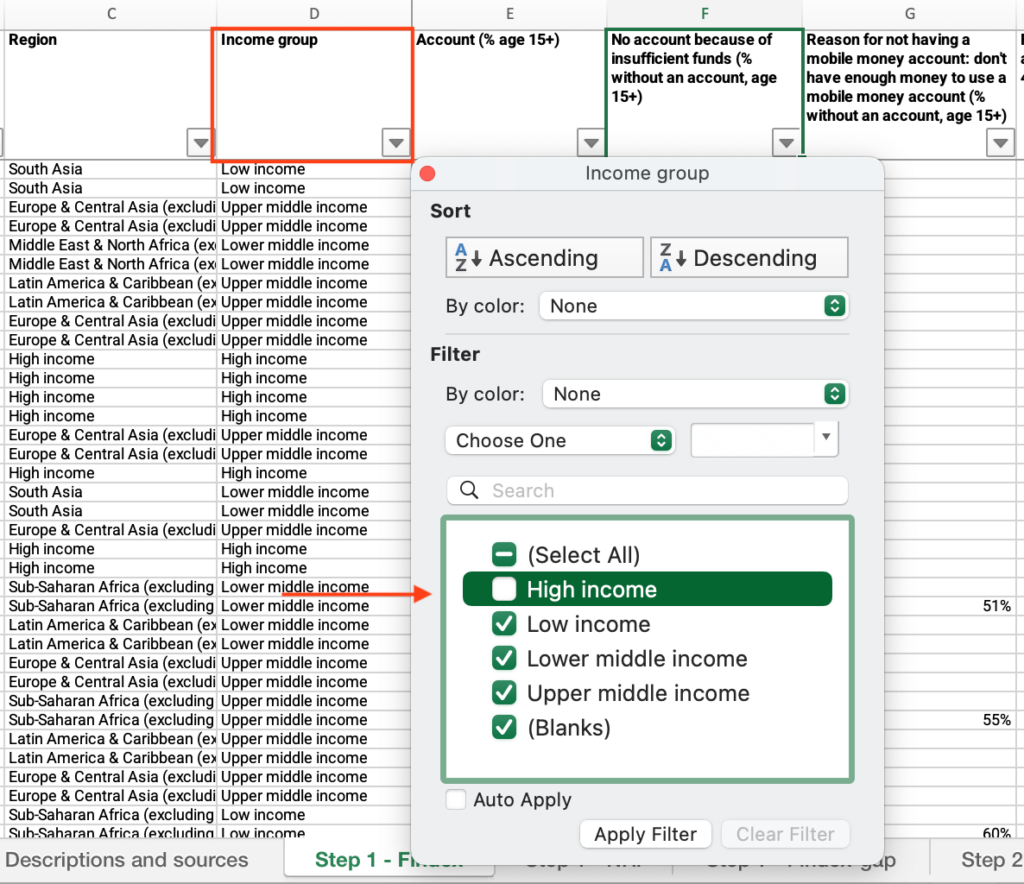
- Locate the “Income group” column > Apply the filter > Uncheck the box next to “High income.”
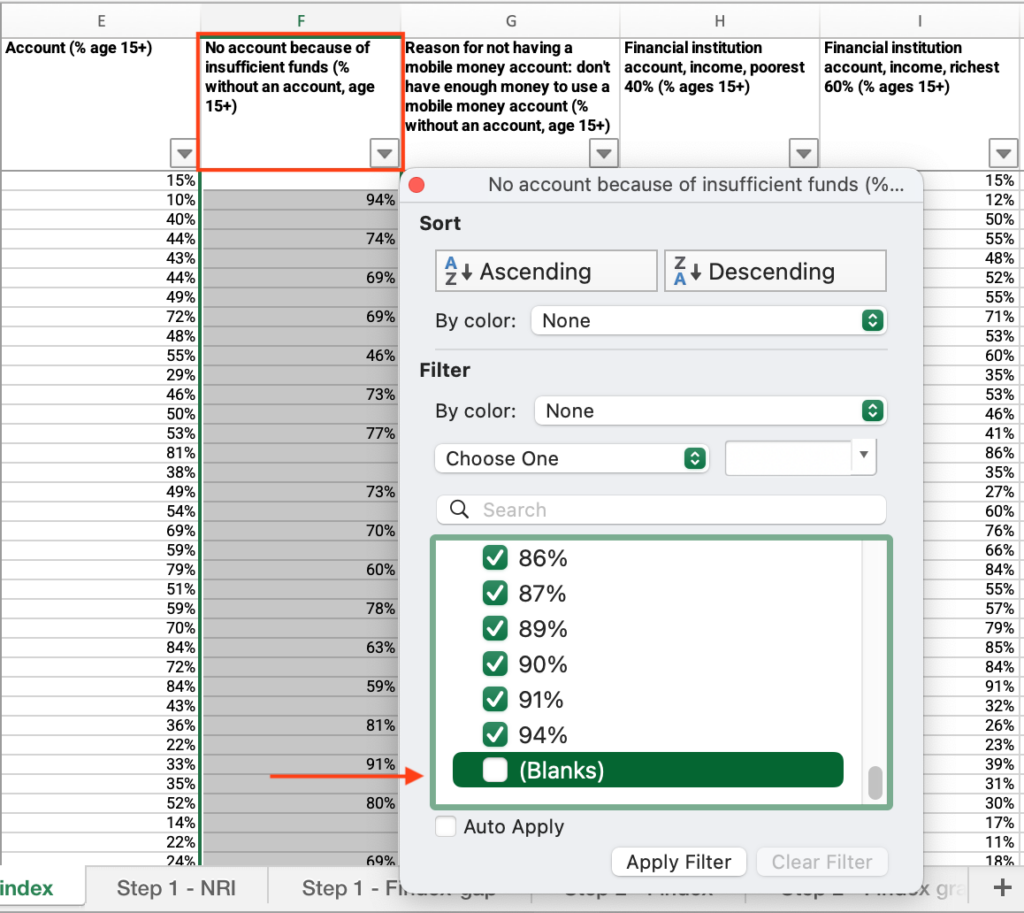
- Locate the “No account because of insufficient funds (% without an account, age 15+)” column > Apply the filter > Uncheck “Blanks.”
- Click and drag to select the entire range of cells under the “No account because of insufficient funds (% without an account, age 15+)” column > Find the average at the bottom of the sheet.
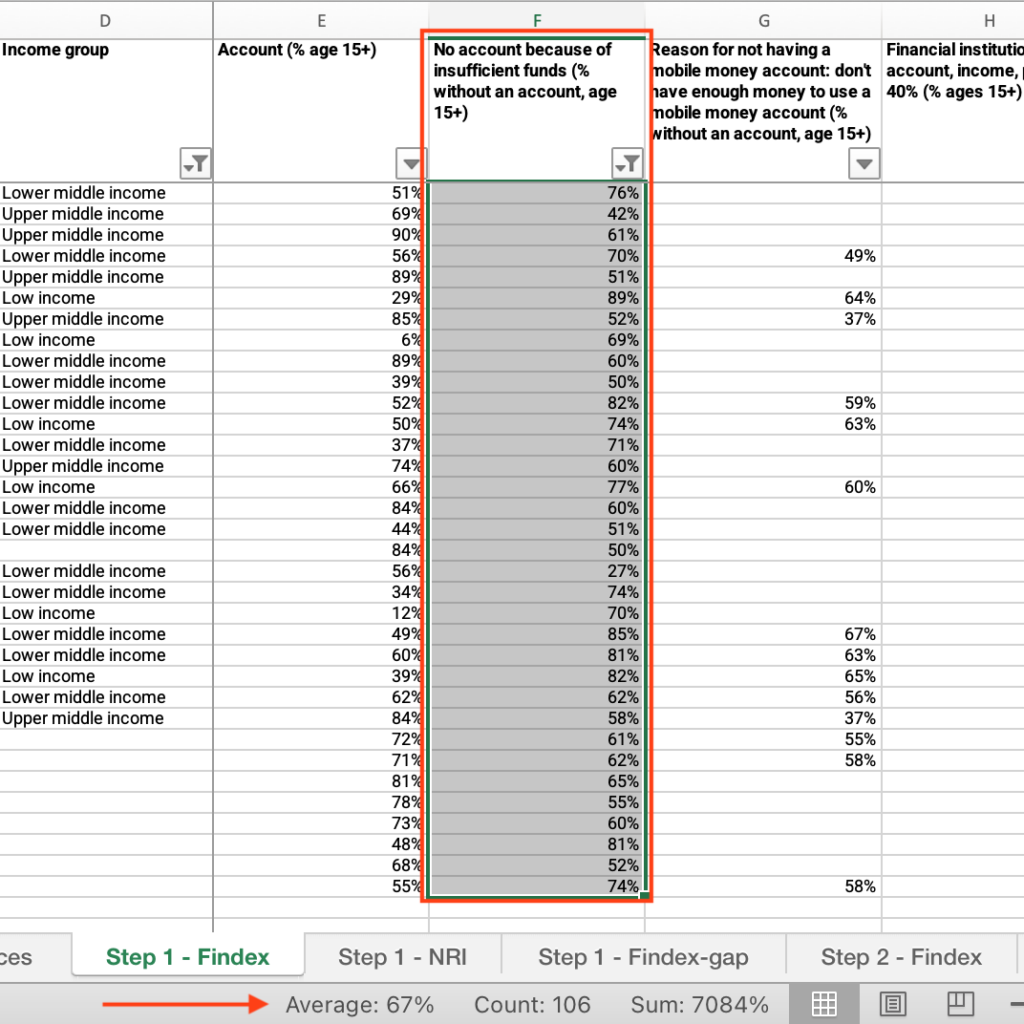
- Compare your country’s value with the average for non-high-income countries and answer the question on the platform.
Step 1: Is the percentage of individuals without a mobile money account due to insufficient funds higher than the average for non-high-income countries (low income, lower middle income, upper middle-income countries)?
- In the “Step 1 – Findex” sheet, locate the country column > Filter by your country.
- Locate the “Reason for not having a mobile money account: don’t have enough money to use a mobile money account (% without an account, age 15+)” column > Find the value.
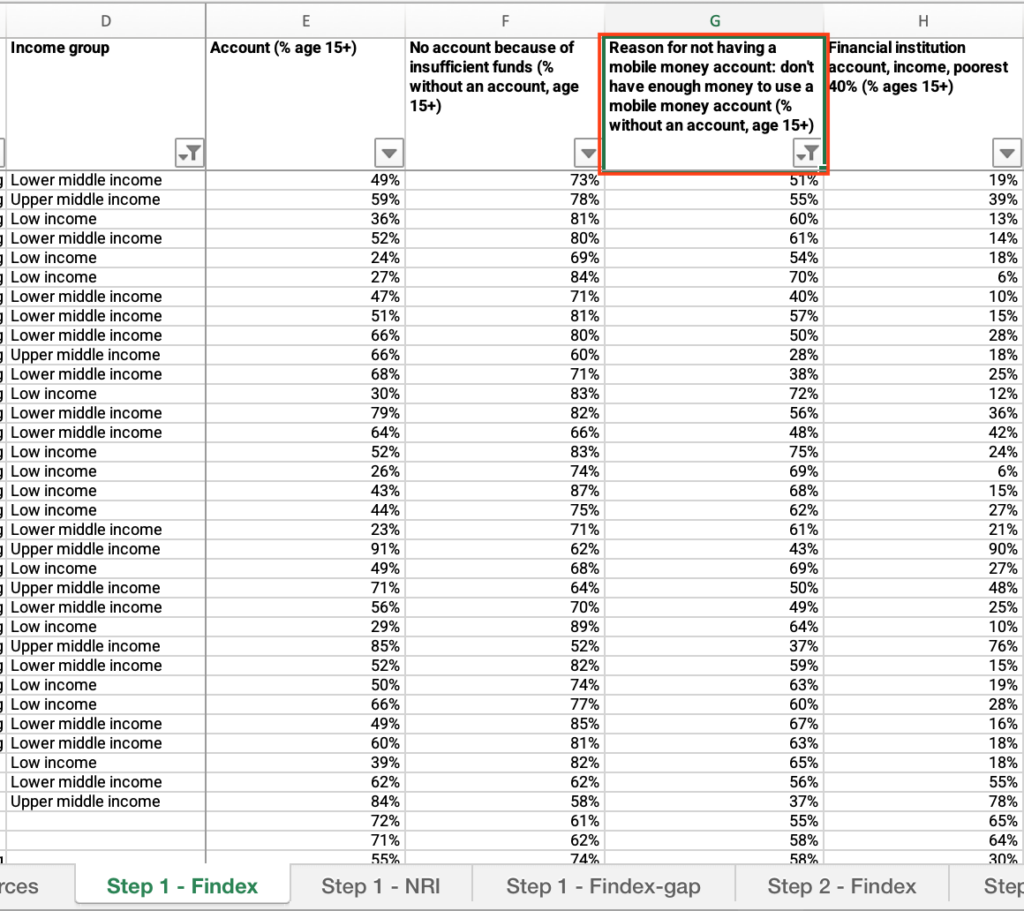
- Locate the “Country” column > Check “Select all.”
- Locate the “Income group” column > Apply the filter > Uncheck the box next to “High income.”
- Locate the “Reason for not having a mobile money account: don’t have enough money to use a mobile money account (% without an account, age 15+)” column > Apply the filter > Uncheck “Blanks.”
- Click and drag to select the entire range of cells under the “Reason for not having a mobile money account: don’t have enough money to use a mobile money account (% without an account, age 15+)” column > Find the average at the bottom of the sheet.
- Compare your country’s value with the average for non-high-income countries and answer the question on the platform.
Step 1: Is the percentage of individuals without a financial account due to insufficient funds in your country higher than the regional average?
- In the “Step 1 – Findex” sheet, locate the “Country” column > Check “Select all.”
- Locate the “Region” column > Filter by your region.
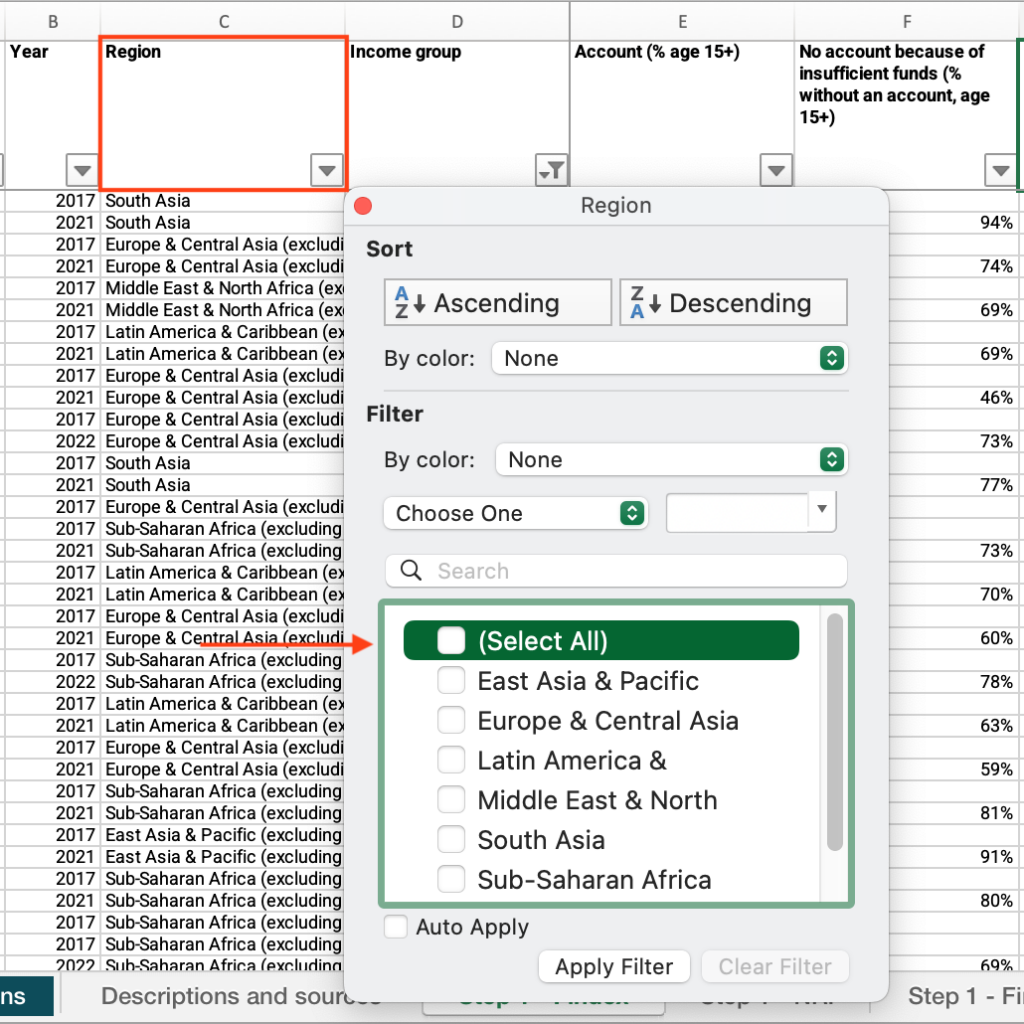
- Click and drag to select the entire range of cells under the “No account because of insufficient funds (% without an account, age 15+)” column > Find the average at the bottom of the sheet.
- Compare your country’s value with the regional average and answer the question on the platform
Step 1: Is the percentage of individuals without a mobile money account due to insufficient funds higher than the regional average?
- In the “Step 1 – Findex” sheet, locate the “Country” column > Check “Select all.”
- Locate the “Region” column > Filter by your region.
- Click and drag to select the entire range of cells under the “Reason for not having a mobile money account: don’t have enough money to use a mobile money account (% without an account, age 15+)” column > Find the average at the bottom of the sheet.
- Compare your country’s value with the regional average and answer the question on the platform
Step 1: Do less than one third of the poorest 40% population in your country have a financial institution account?
- In the “Step 1 – Findex” sheet, locate the “Financial institution account, income, poorest 40% (% ages 15+)” column > Find the value and answer the question on the platform.
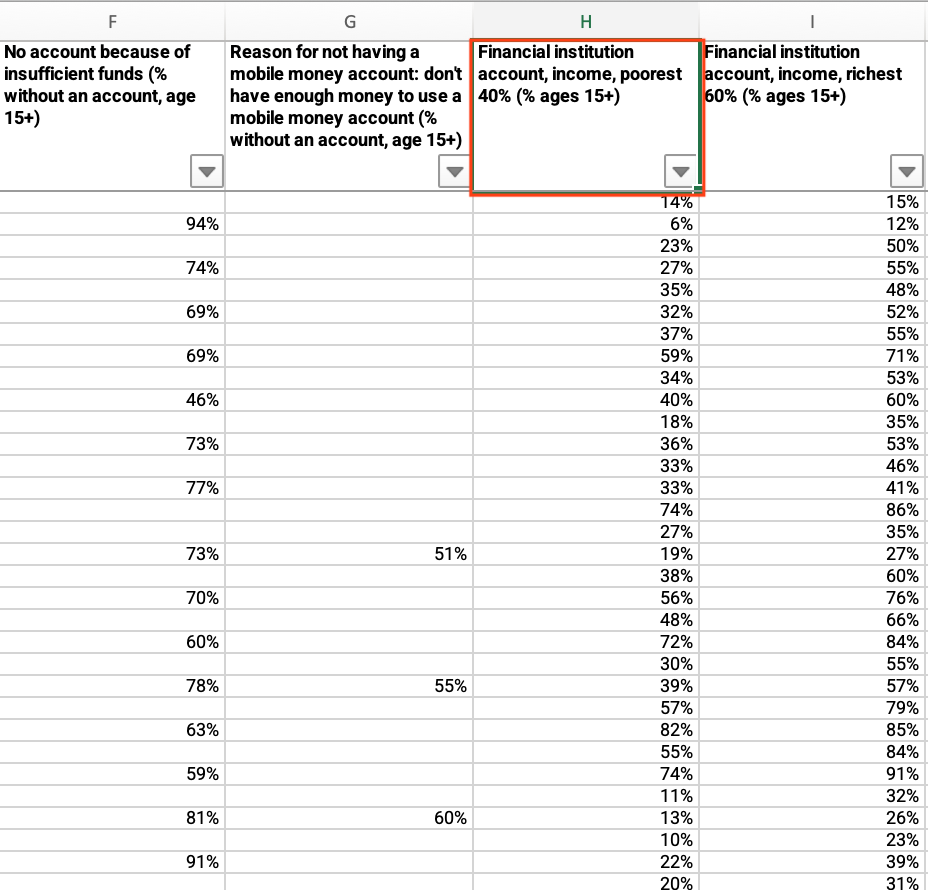
Step 1: How does your country compare with countries within the same geographical region?
- In the “Step 1 – Findex” sheet, locate the “Country” column > Check “Select all.”
- Locate the “Region” column > Filter by your region.
- Click and drag to select the entire range of cells under the “Financial institution account, income, poorest 40% (% ages 15+)” column > Find the average at the bottom of the sheet.
- Compare your country’s value with the regional average and answer the question on the platform.
Step 1: Is the score in the indicator Socio-economic gap in the use of digital payments less than 60?
- Open the “Step 2 – NRI” sheet.
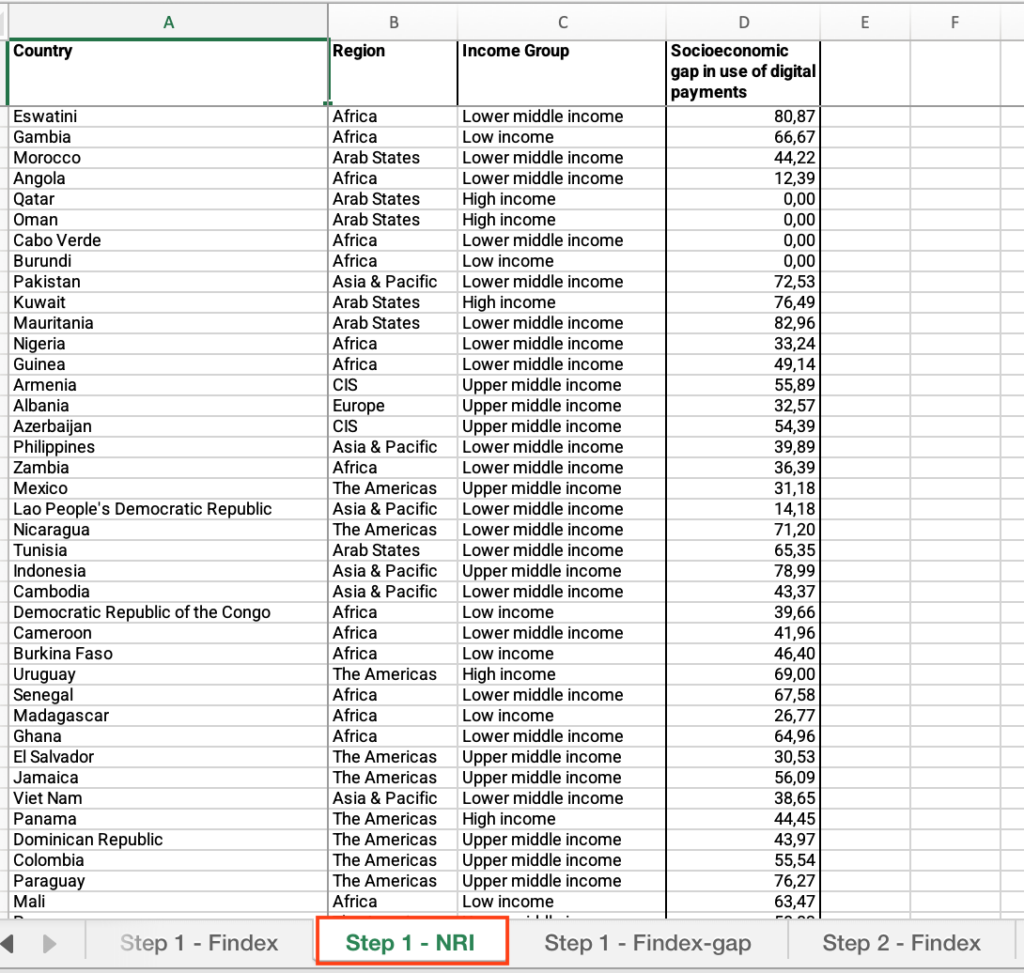
- Locate the “Country” column > Filter by your country.
- Locate the “Socioeconomic gap in use of digital payments” column > Find the value.
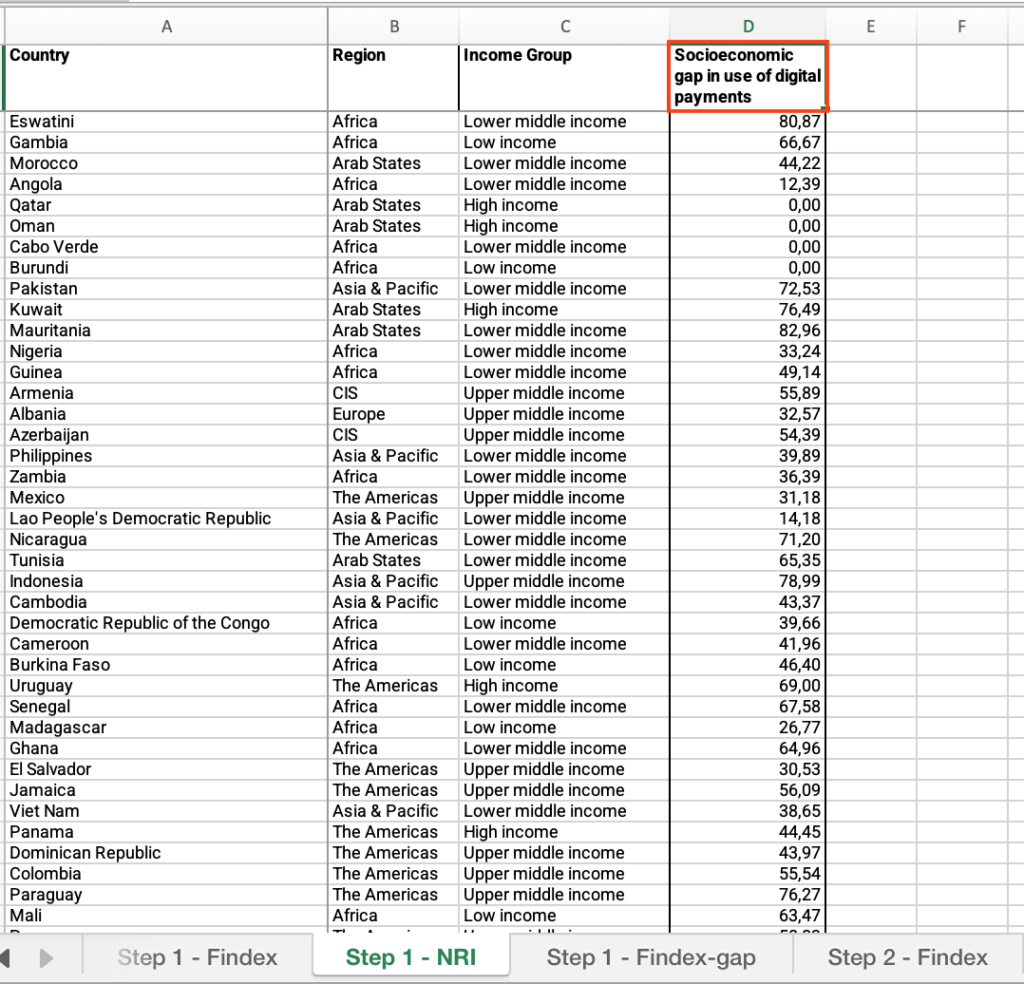
- Locate the “Country” column > Check “Select all.”
- Locate the “Income Group” column > Apply the filter > Uncheck the box next to “High income.”
- Click and drag to select the entire range of cells under this column > Find the average at the bottom of the sheet.
- Compare your country’s value with the average for non-high-income countries and answer the question on the platform.
Step 1: Is the socioeconomic gap in the use of digital payments in your country higher than the regional average?
- In the “Step 2 – NRI” sheet, locate the “Country” column > Check “Select all.”
- Locate the “Region” column > Filter by your region.
- Click and drag to select the entire range of cells under the “Socioeconomic gap in use of digital payments” column > Find the average at the bottom of the sheet.
- Compare your country’s value with the regional average and answer the question on the platform.
Step 1: Does the data reveal an income gap greater than 15 percentage points in the ownership of financial institution accounts?
- Open the “Step 1 – Findex-gap” sheet.
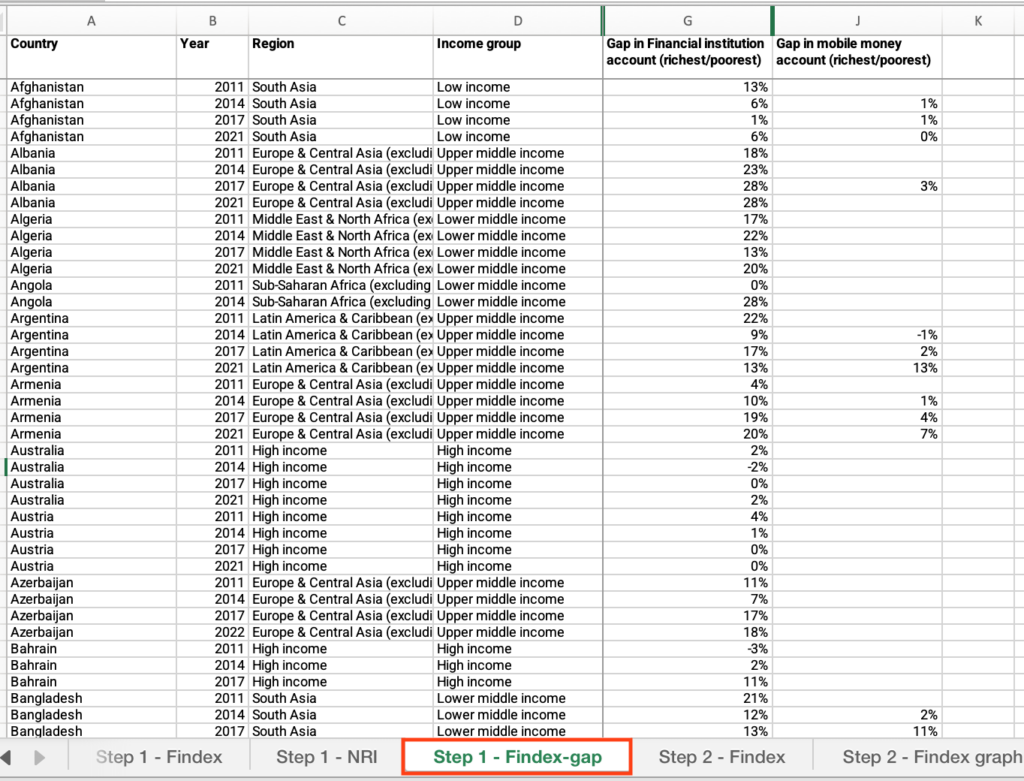
- Locate the “Country” column > Filter by your country.
- Locate the “Gap in Financial institution account (richest/poorest)” column > Find the value and answer the question on the platform.
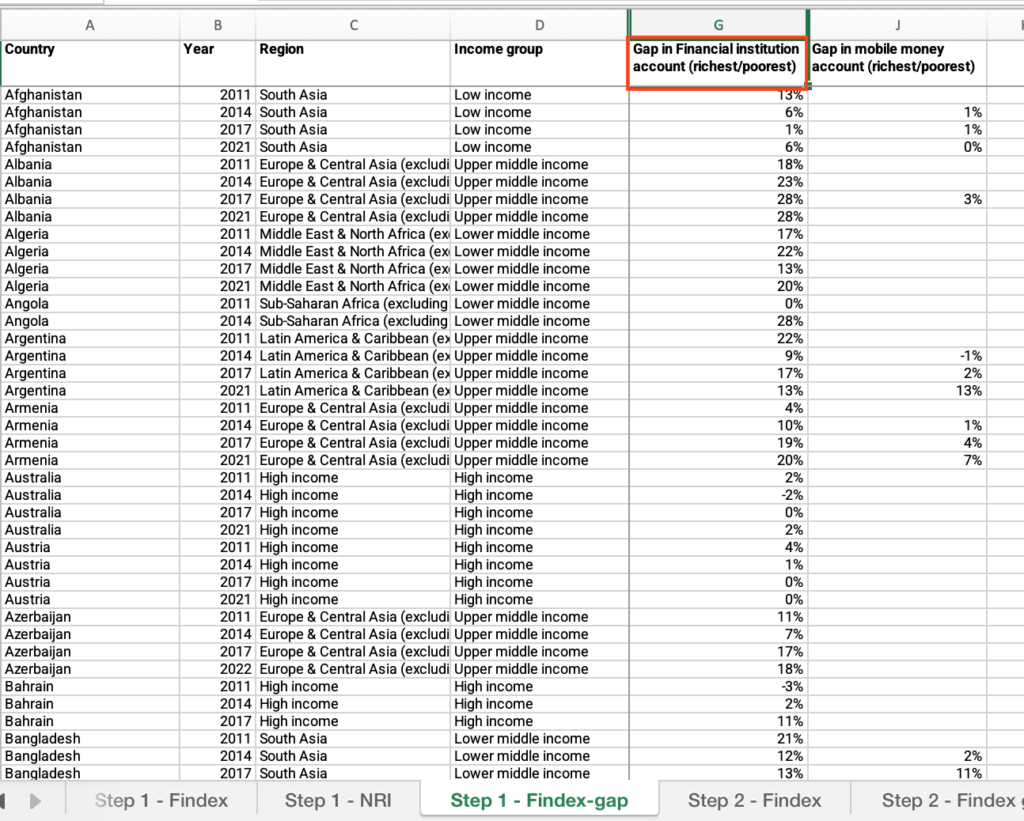
Step 1: How does your country’s financial institution account gap compare with your regional group?
- In the “Step 1 – Findex-gap” sheet, locate the “Country” column > Check “Select all.”
- Locate the “Region” column > Filter by your region.
- Click and drag to select the entire range of cells under the “Gap in Financial institution account (richest/poorest)” column > Find the average at the bottom of the sheet.
- Compare your country’s value with the regional average and answer the question on the platform.
Step 1: Does the data reveal an income gap greater than 10 percentage points in the ownership of mobile money accounts?
- In the “Step 1 – Findex-gap” sheet, locate the “Country” column > Filter by your country.
- Locate the “Gap in mobile money account (richest/poorest)” column > Find the value and answer the question on the platform.
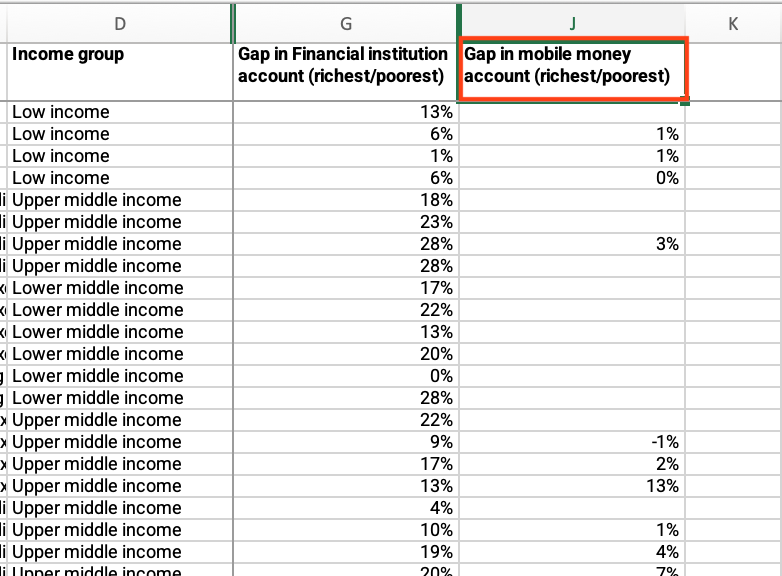
Step 1: How does your country’s mobile money account ownership gap compare with your regional group?
- In the “Step 1 – Findex-gap” sheet, locate the “Country” column > Check “Select all.”
- Locate the “Region” column > Filter by your region.
- Click and drag to select the entire range of cells under the “Gap in mobile money account (richest/poorest)” column > Find the average at the bottom of the sheet.
- Compare your country’s value with the regional average and answer the question on the platform
Step 2: Is the percentage of individuals without a financial account due to distance in your country higher than the average for non- high-income countries (low income, lower middle income, upper middle-income countries)?
- Open the “Step 2 – Findex” sheet, locate the “Country”column > Filter by your country.
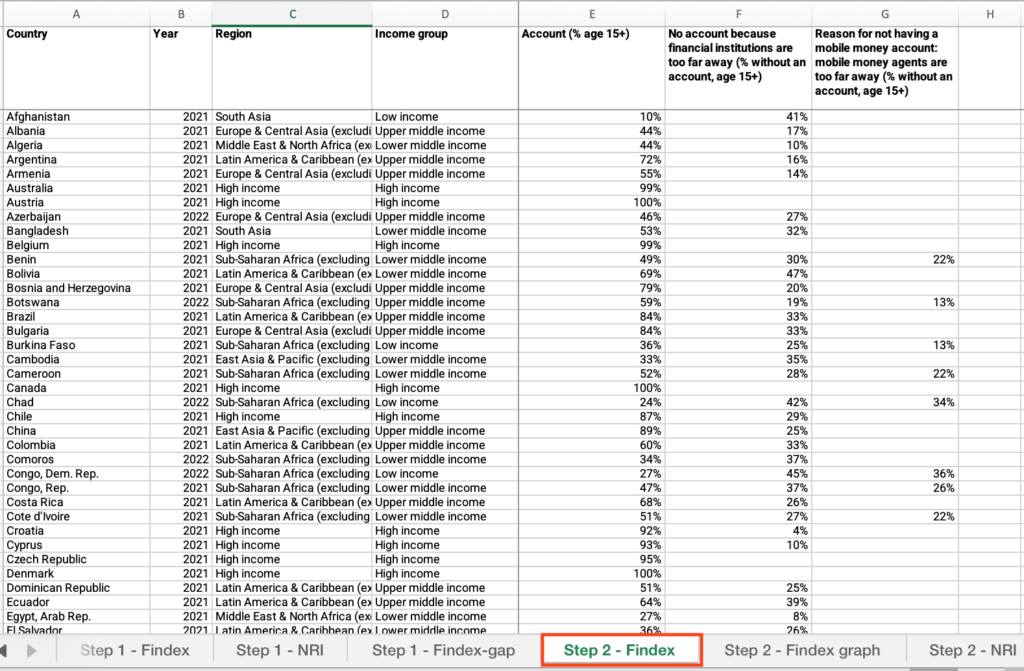
- Locate the “No account because financial institutions are too far away (% without an account, age 15+)” column > Find the value.
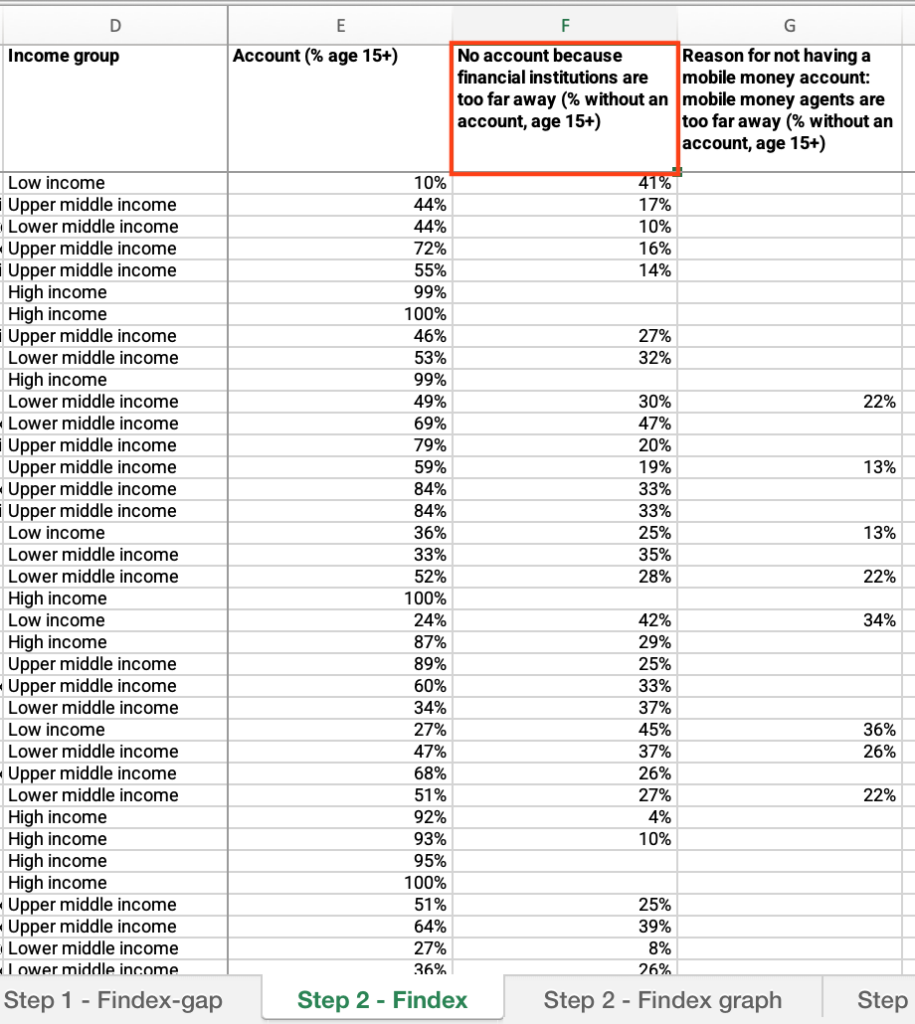
- Locate the “Country” column > Check “Select all.”
- Locate the “Income group” column > Apply the filter > Uncheck the box next to “High income.”
- Locate the “No account because financial institutions are too far away (% without an account, age 15+)” column > Click and drag to select the entire range of cells under this column > Find the average at the bottom of the sheet.
- Compare your country’s value with the average for non-high-income countries and answer the question on the platform.
Step 2: Is the percentage of individuals without a financial account due to distance in your country higher than the regional average?
- In the “Step 2 – Findex” sheet, locate the “Country”column > Check “Select all.”
- Locate the “Region” column > Filter by your region.
- Locate the “No account because financial institutions are too far away (% without an account, age 15+)” column > Click and drag to select the entire range of cells under this column > Find the average at the bottom of the sheet.
- Compare your country’s value with the regional average and answer the question on the platform.
Step 2: Is the percentage of individuals without a mobile money account due to distance significantly higher than the average for all countries in the sample?
- In the “Step 2 – Findex” sheet, locate the “Country”column > Filter by your country.
- Locate the “Reason for not having a mobile money account: mobile money agents are too far away (% without an account, age 15+)” column > Find the value.
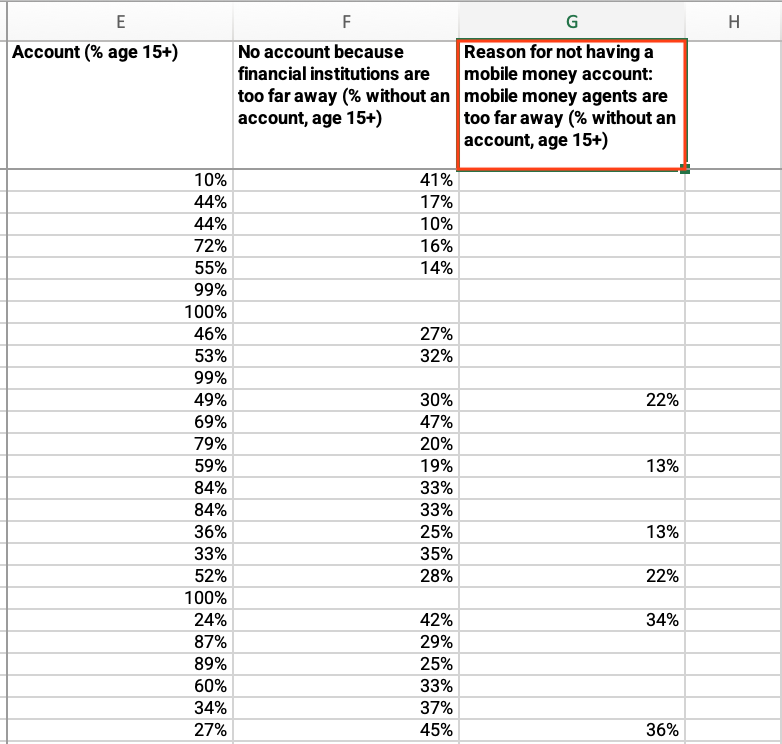
- Locate the “Country” column > Apply the filter > Check “Select all.”
- Locate the “Reason for not having a mobile money account: mobile money agents are too far away (% without an account, age 15+)” column > Click and drag to select the entire range of cells under this column > Find the average at the bottom of the sheet.
- Compare your country’s value with all countries in the sample and answer the question on the platform.
Step 2: Is the percentage of individuals without a mobile money account due to distance in your country higher than the regional average?
- In the “Step 2 – Findex” sheet, locate the “Country”column > Apply the filter > Check “Select all.”
- Locate the “Region” column > Filter by your region.
- Locate the ““Reason for not having a mobile money account: mobile money agents are too far away (% without an account, age 15+)” column > Click and drag to select the entire range of cells under this column > Find the average at the bottom of the sheet.
- Compare your country’s value with the regional average and answer the question on the platform.
Step 2: Where is your country located in the graph?
- Open the “Step 2 – Findex graph” sheet.
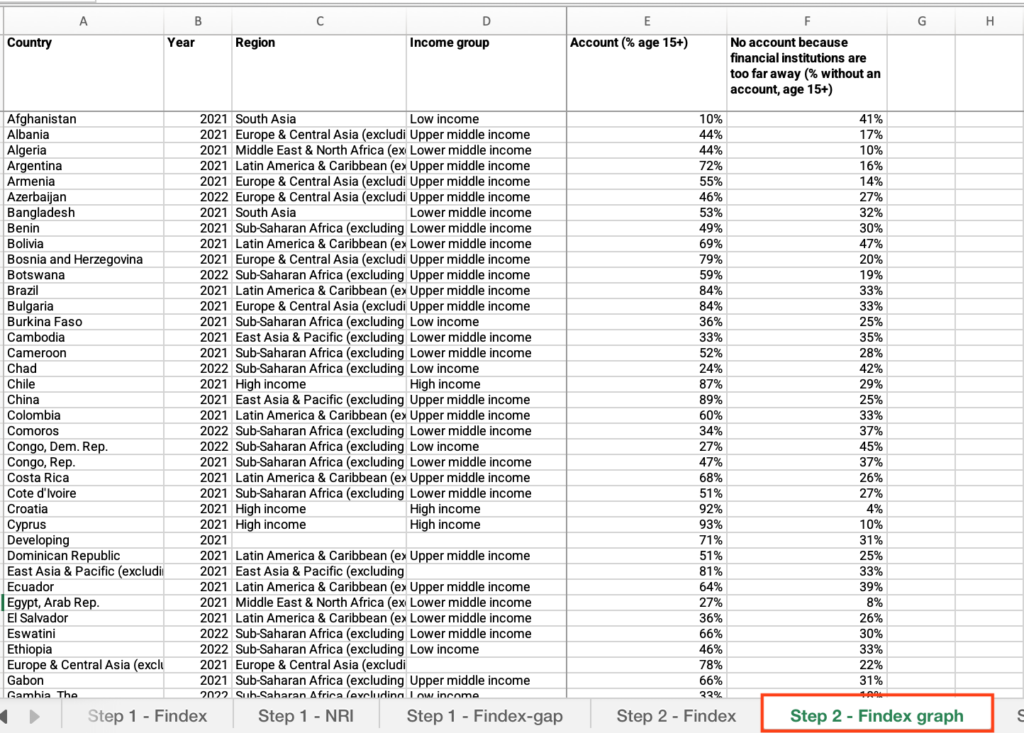
- Locate an empty cell outside the data range, not associated with any row or column containing data > Click on the empty cell.
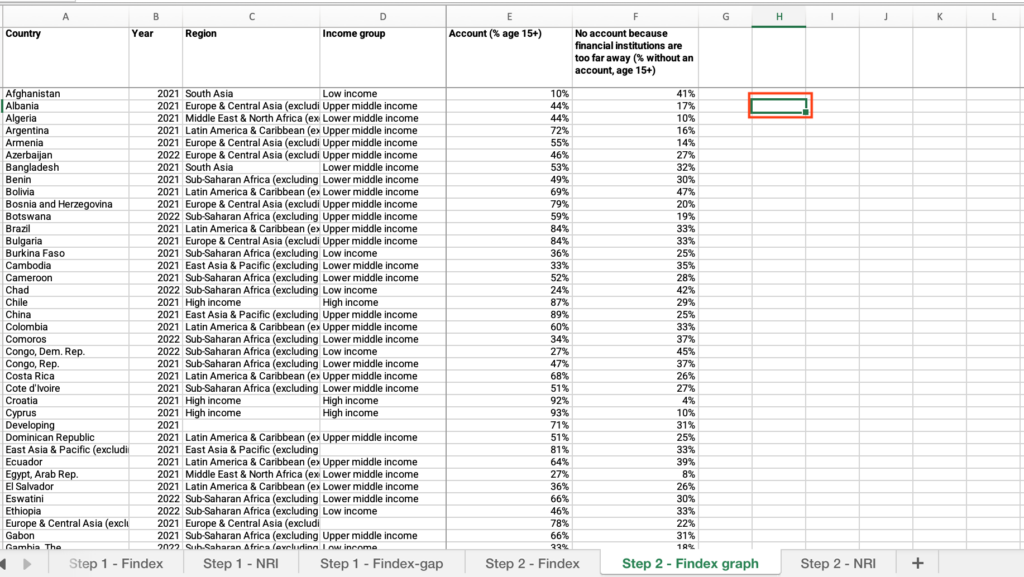
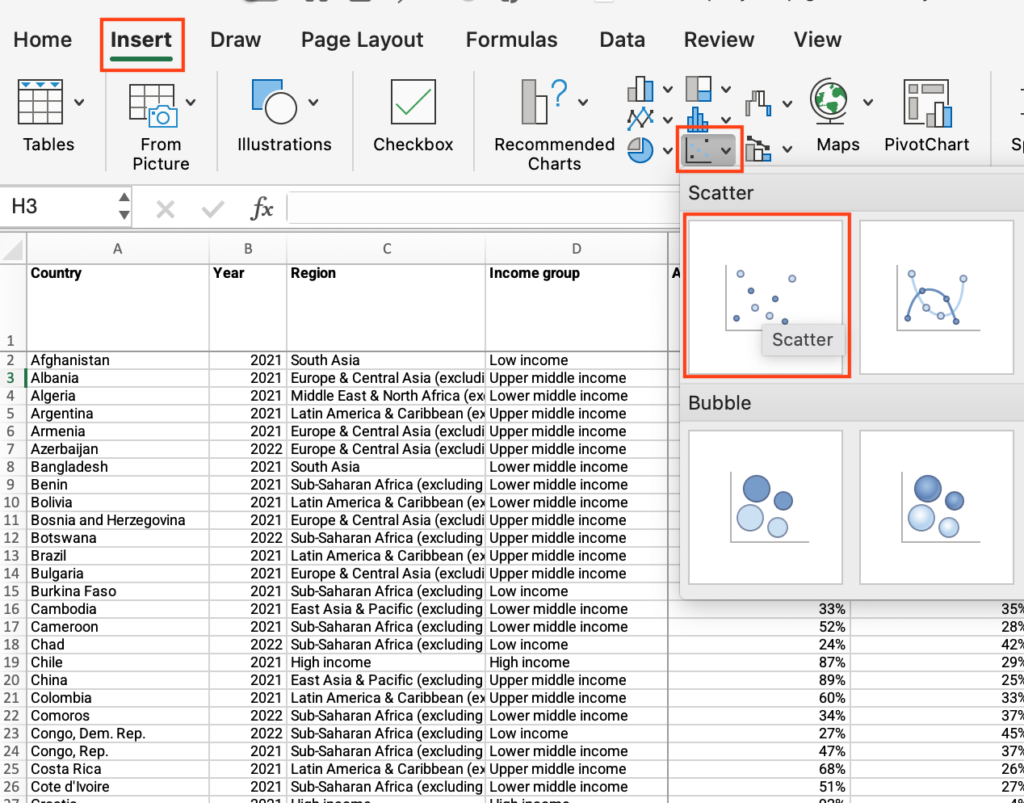
- Click the Insert menu > Locate the charts icons > click the Scatter plot icon > select “Scatter.”
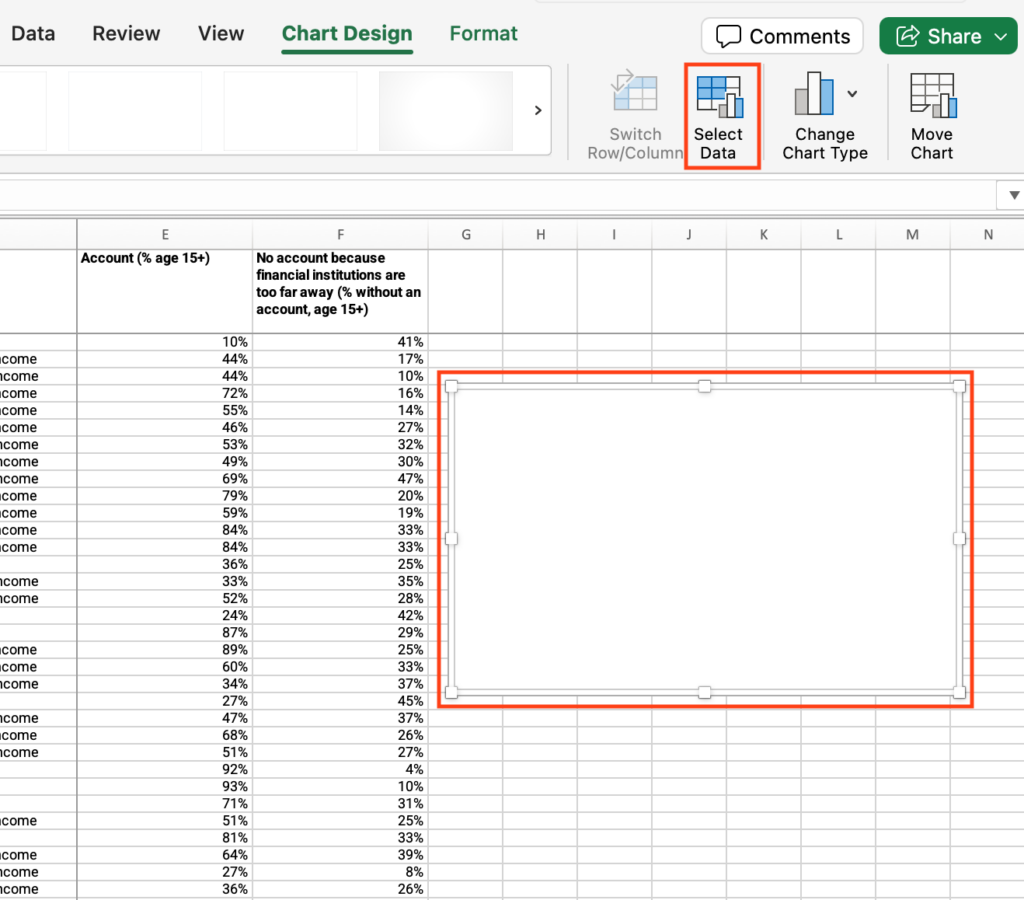
- Click on the chart area > Click the Chart Design menu > click “Select data.”
- Make sure the “Show data in hidden rows and columns” checkbox from the “Hidden and Empty Cells” options is unmarked.
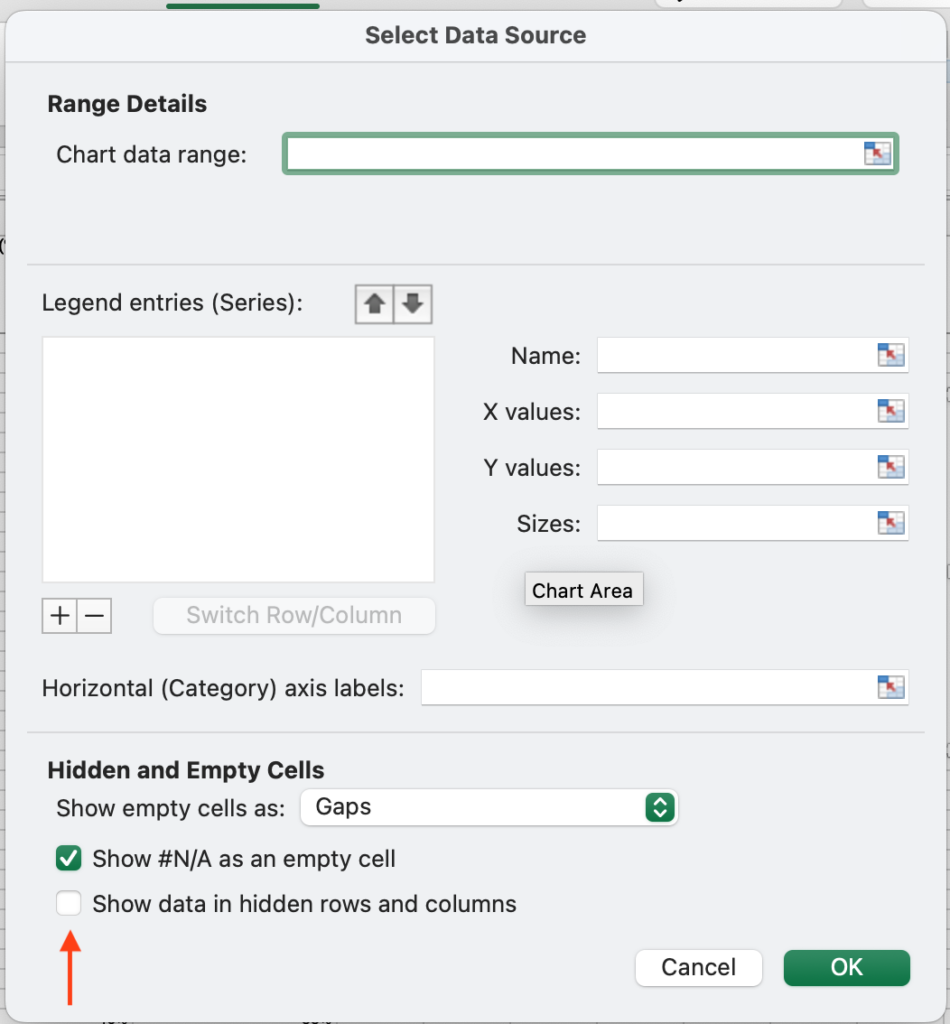
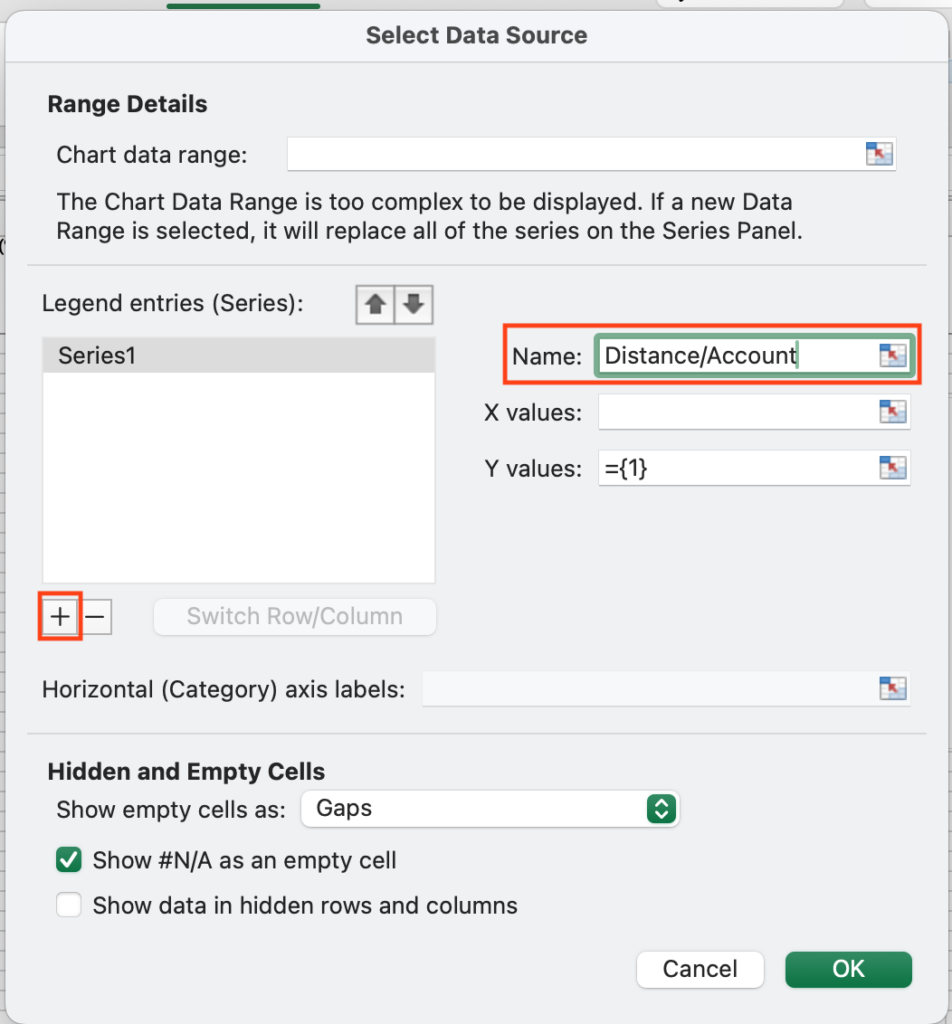
- Click on the + sign to add a series > In the “Series name” field, type “Distance/Account.”
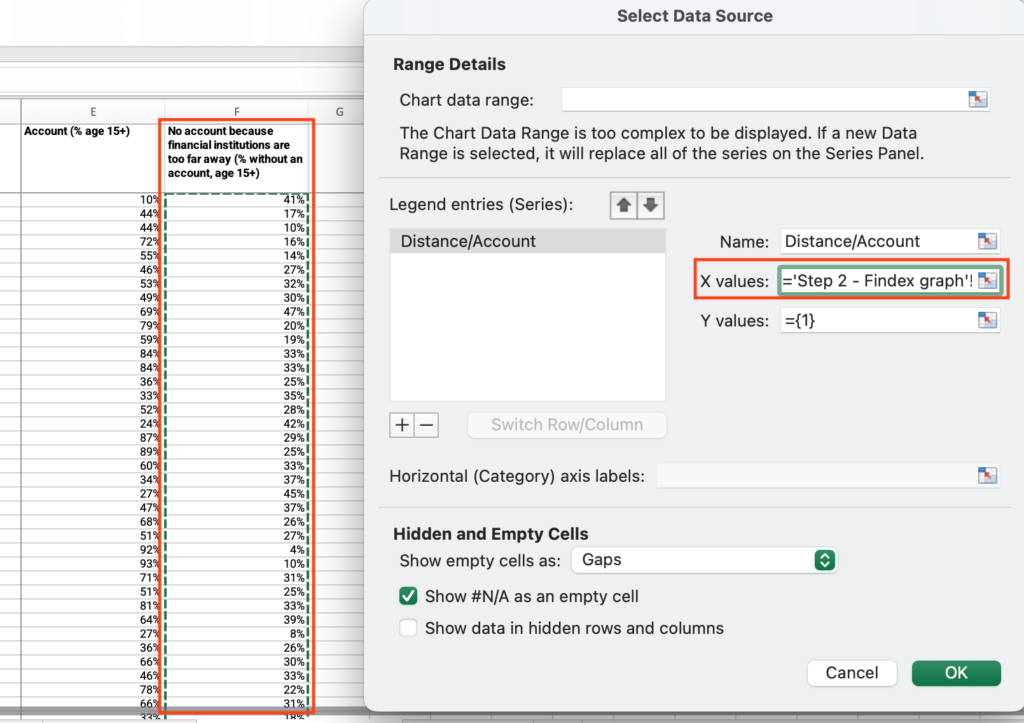
- Click the “X values” field > Select all cells under the “No account because financial institution too far away (% without an account, age 15+)” column.
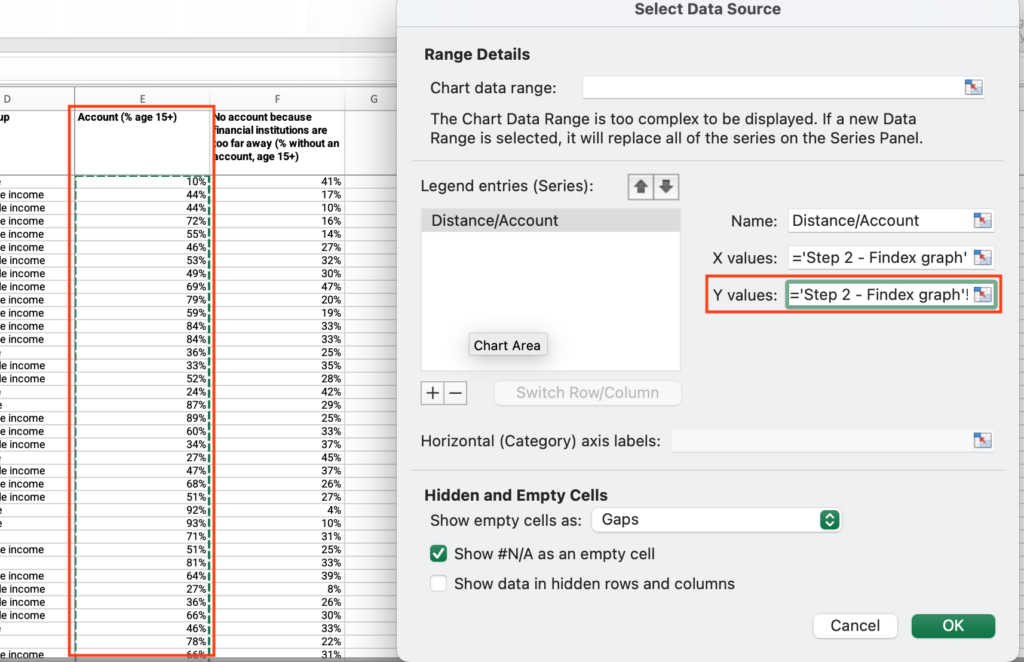
- Click the “Y values” field > Select all cells under the “Account (% age 15+)” column. Press “OK.”
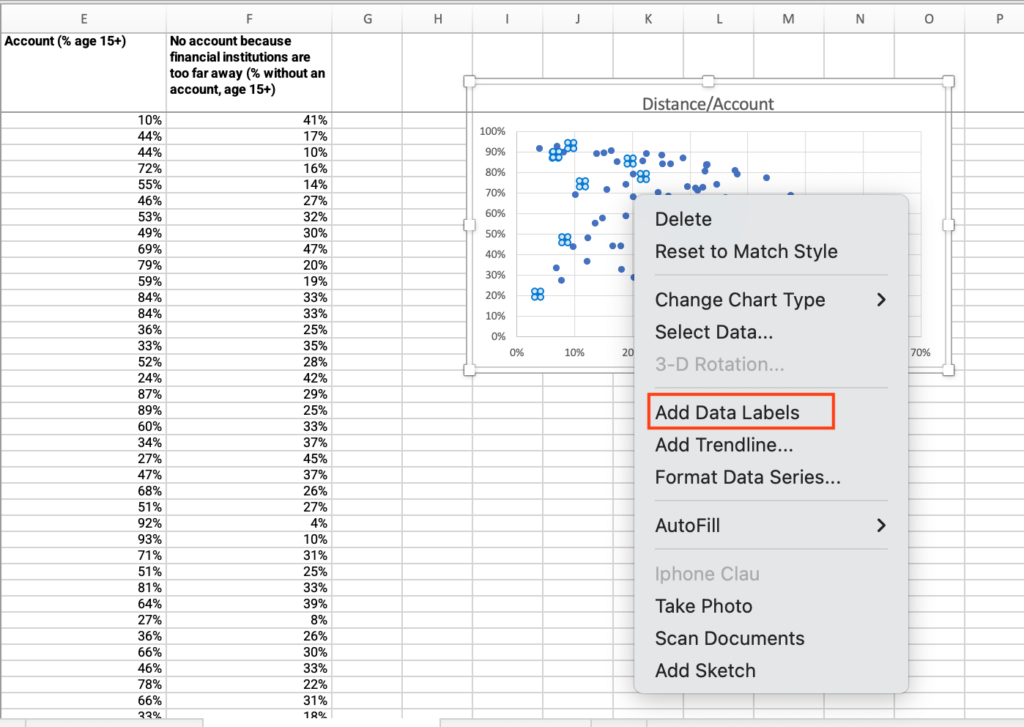
- Right click on one of the data points > select “Add data label.”
- Right click on one of the data points > select “Format data label.”
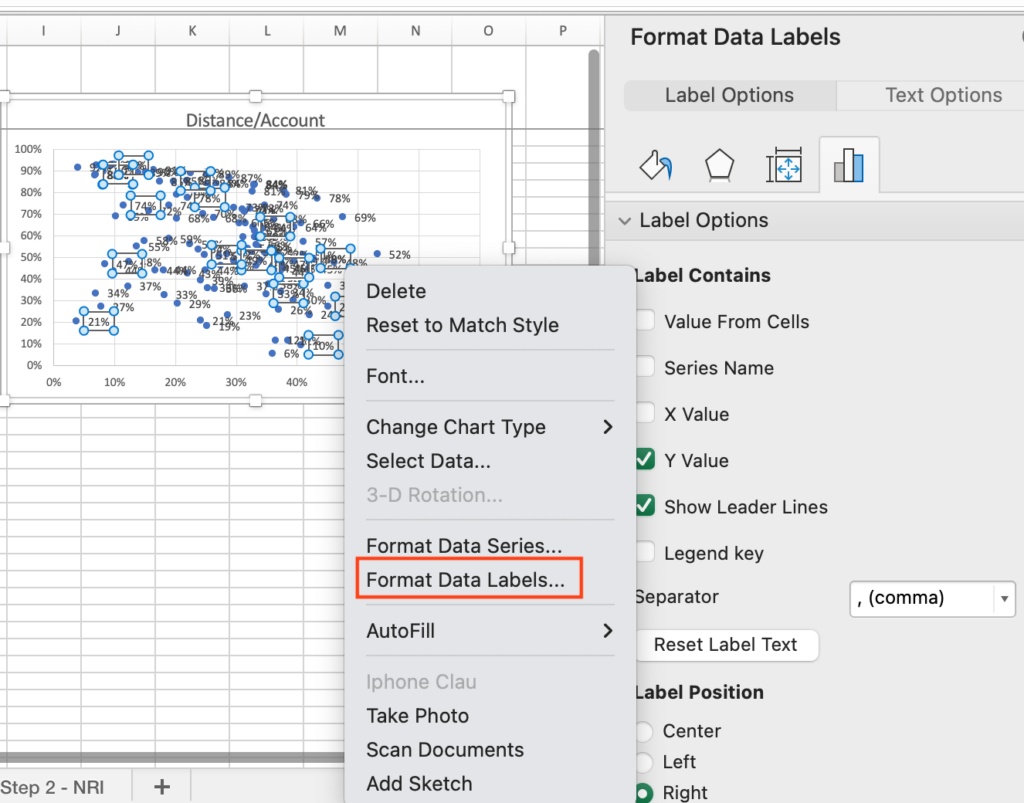
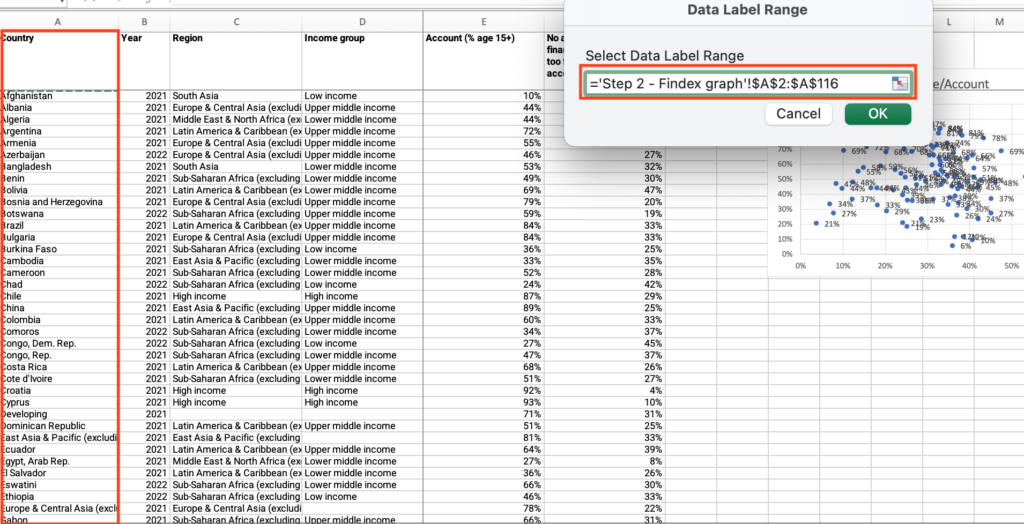
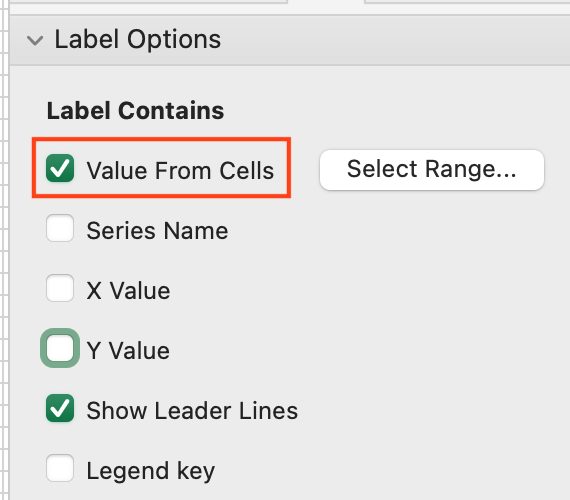
- Under “Label contains” check “Value from cells” > Select all cells with values under the “Country” column > Press OK.
- Uncheck “Y value.”
- Analyze the output and answer the question on the platform.
Step 2: Is the score in the indicator Rural gap in use of digital payments less than 70?
- Open the “Step 2 – NRI” sheet.
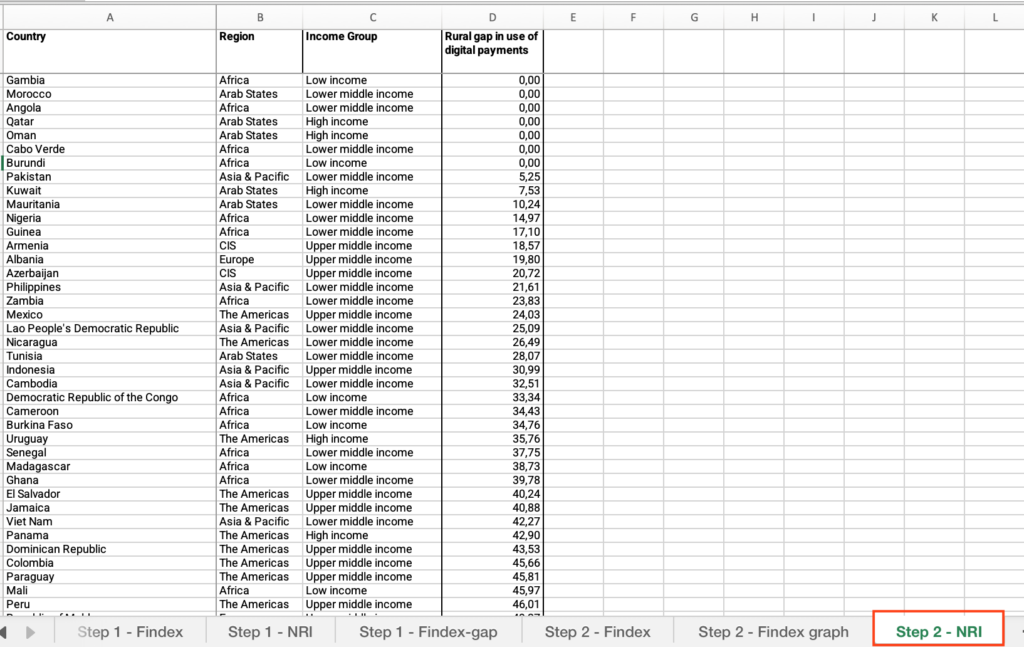
- Locate the “Country” column > Filter by your country.
- Locate the “Rural gap in use of digital payments” column > Find the value.
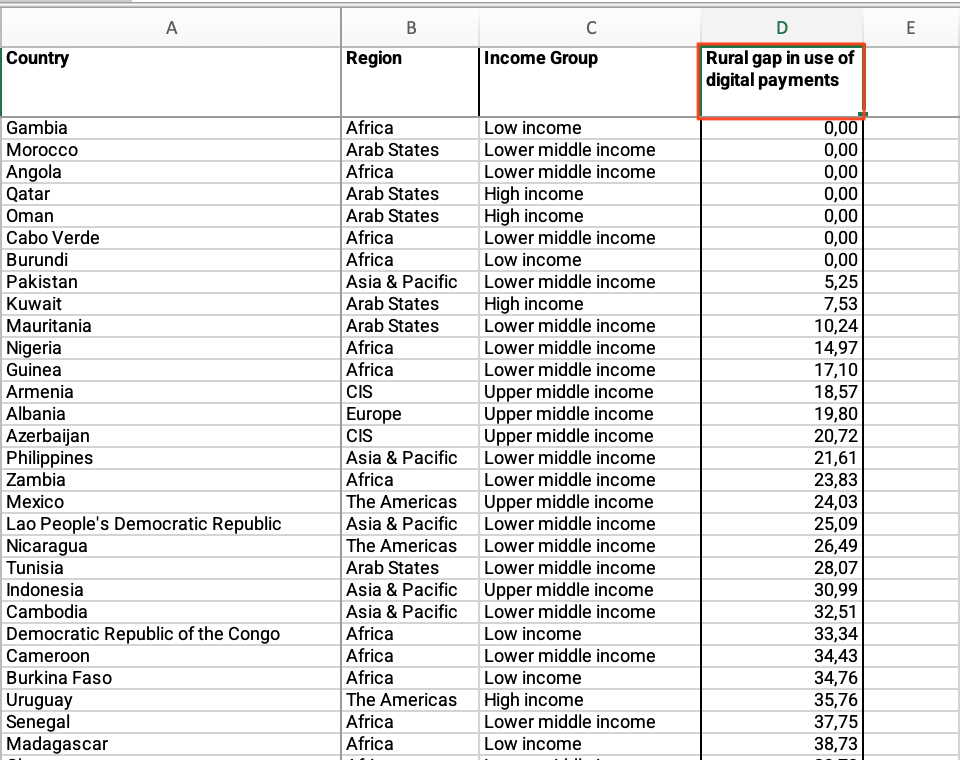
Step 2: Is the rural gap in the use of digital payments in your country higher than the regional average?
- In the “Step 2 – NRI” sheet, locate the “Country” column > Check “Select all.”
- Locate the “Region” column > Filter by your region.
- Locate the “Rural gap in use of digital payments” column > Click and drag to select the entire range of cells under this column > Find the average at the bottom of the sheet.
- Compare your country’s value with the regional average and answer the question on the platform.
