Module 10 Assignment – Excel Tutorials
The following tutorial is an optional resource meant to assist you in navigating the databases and collecting the necessary data for your analysis.
Note on recording your responses: In the assignment you will find all the necessary fields to record your answers and the data you collect. You will also find an optional Answer Sheet Excel file to keep record of the collected data and your findings. You will find this file in the assignment’s introduction.
Step 1: What is your country’s score on the overall Global Gender Gap Index for the latest available year?
- Open the “M10 – Step-by-step guide to analyze restrictive social norms – databases.xlsx” file > Open the “Step 1 – WEF Gender Gap Index” sheet.
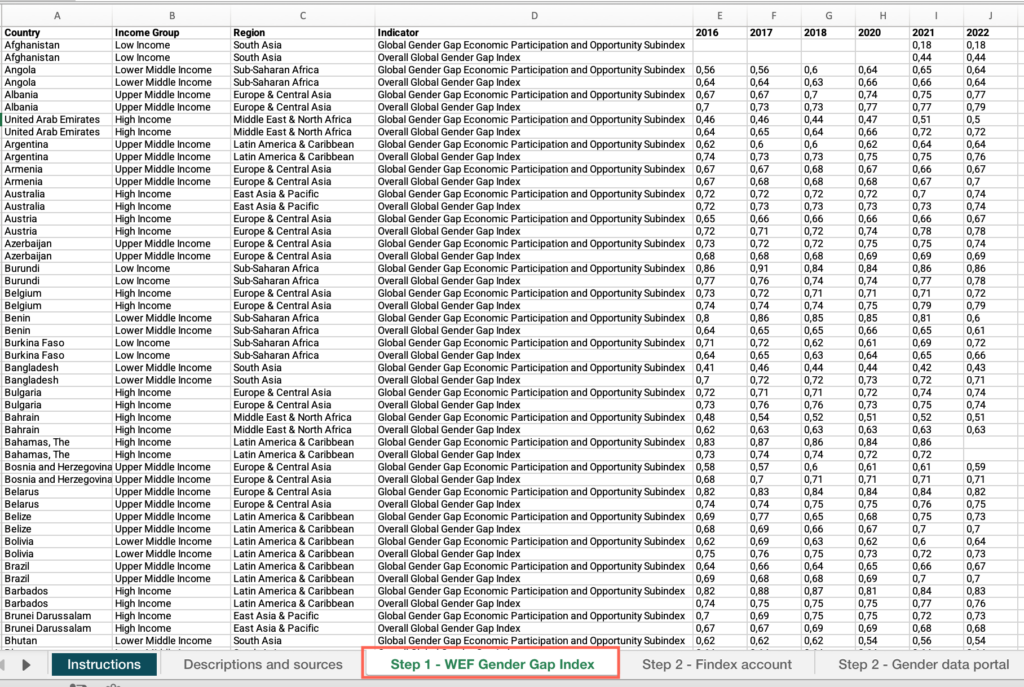
- Right-click on the status bar at the bottom of the Excel window > In the dialog box that appears, ensure that the checkbox for “Average” is checked.
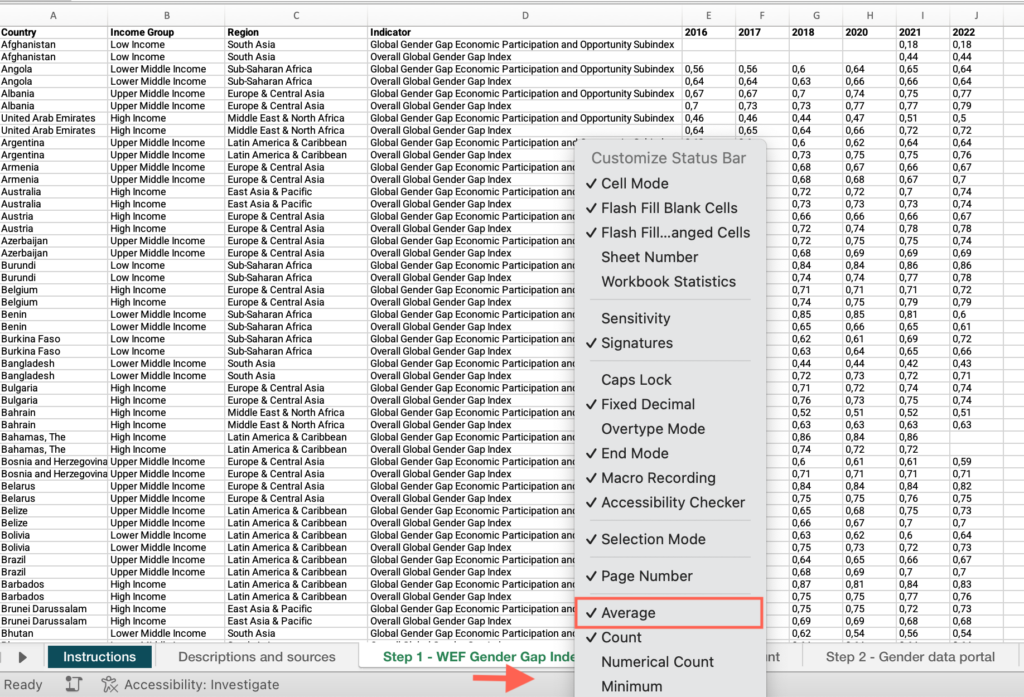
- Select the header row > click the Data menu > Select “Filter”.
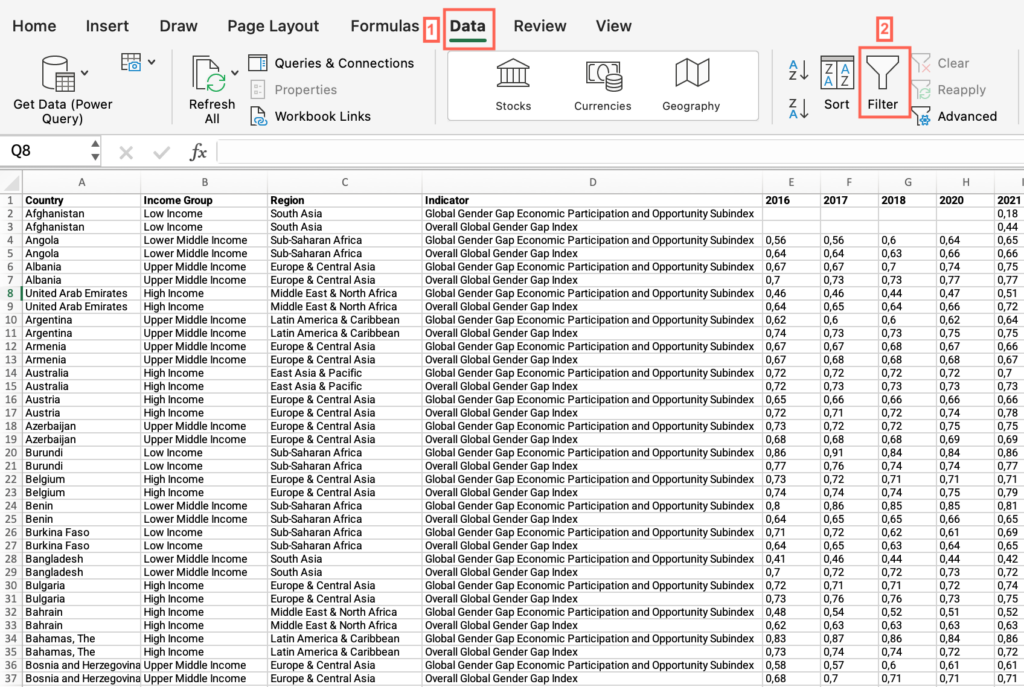
- Now that “Filter” is enabled, click on the dropdown arrow in the “Country” column header > Uncheck “Select all” > Check the box for your country.
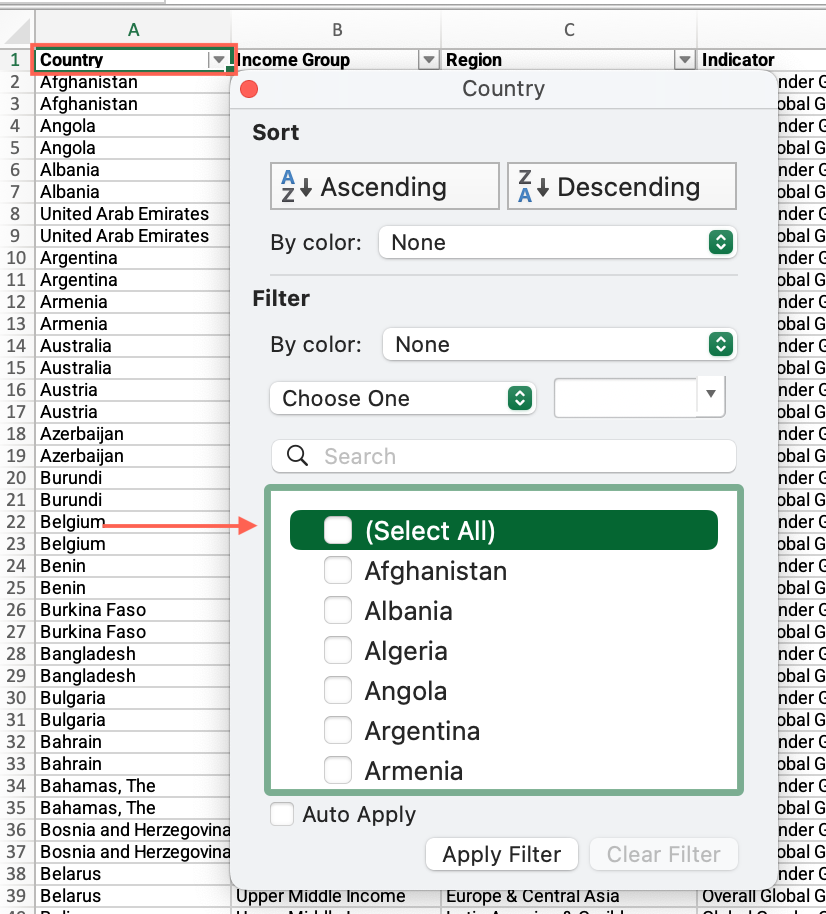
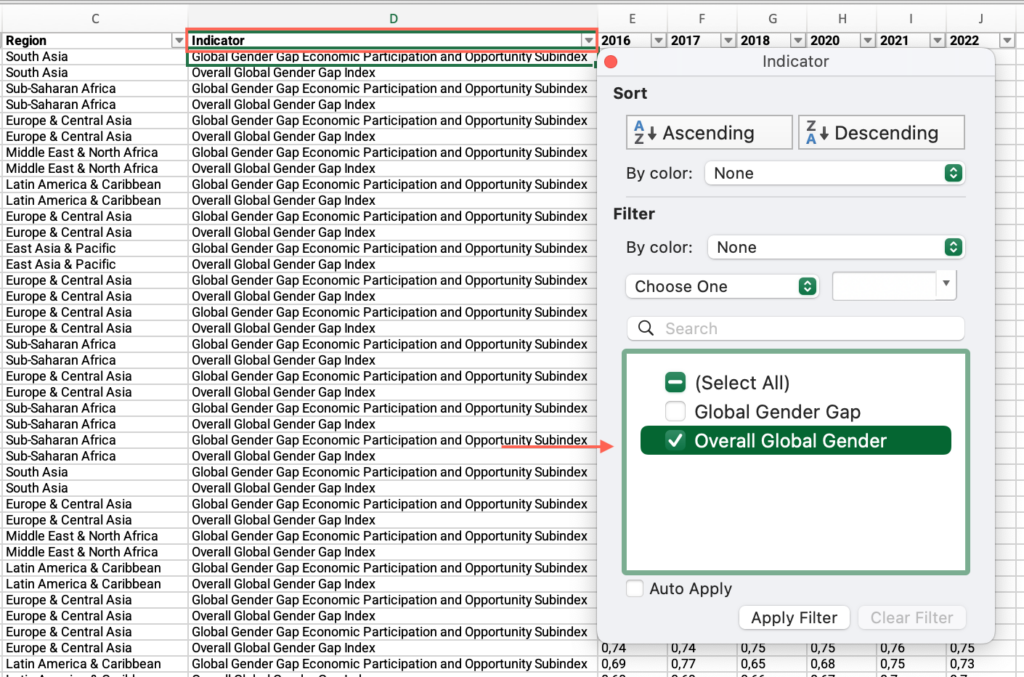
- Locate the “Indicator” column > Uncheck “Select all” > Check the box for the Overall Global Gender Gap Index indicator.
- Move across columns to find the latest available year for your country > Find the value and answer the question on the platform.
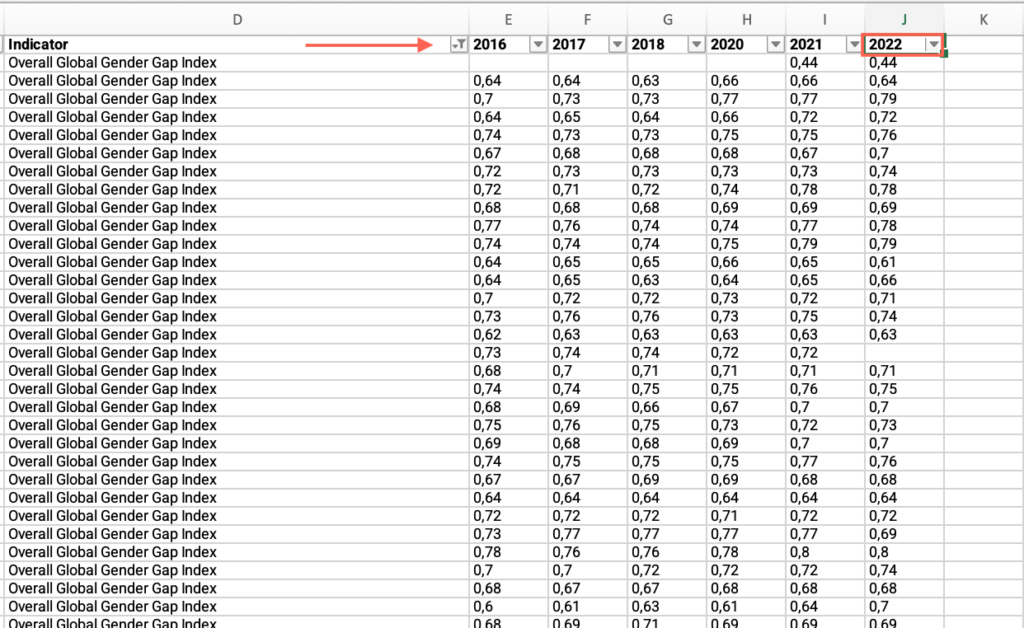
Step 1: If the score is less than 75, how does it compare with previous years?
- In the “Step 1 – WEF Gender Gap Index” sheet, locate the values for the previous available years and answer the question on the platform.
Step 1: What is your country’s score on the Economic Participation and Opportunity subindex?
- In the “Step 1 – WEF Gender Gap Index” sheet, locate the “Country” column > Filter by your country.
- Locate the “Indicator” column > Uncheck “Select all” > Check the box for the Economic Participation and Opportunity subindex indicator.
- Move across columns to find the latest available year for your country > Find the value and answer the question on the platform.
Step 1: Is your country’s score on the overall Global Gender Gap index below your income group average?
- In the “Step 1 – WEF Gender Gap Index” sheet, locate the “Country” column > Check “Select all.”
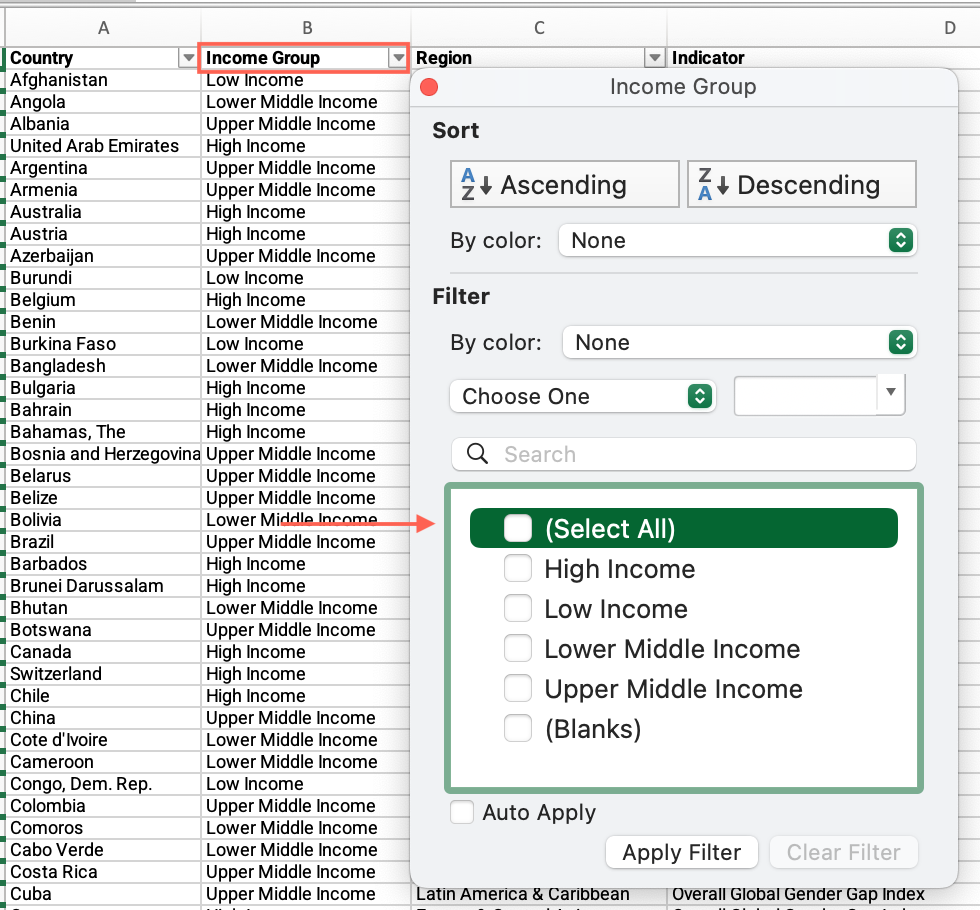
- Locate the “Income group” column > Filter by your income group.
- Locate the “Indicator” column > Uncheck “Select all” > Check the box for the Overall Global Gender Gap Index indicator.
- Locate the column for your country’s latest available year > Apply the filter > Uncheck “Blanks.”
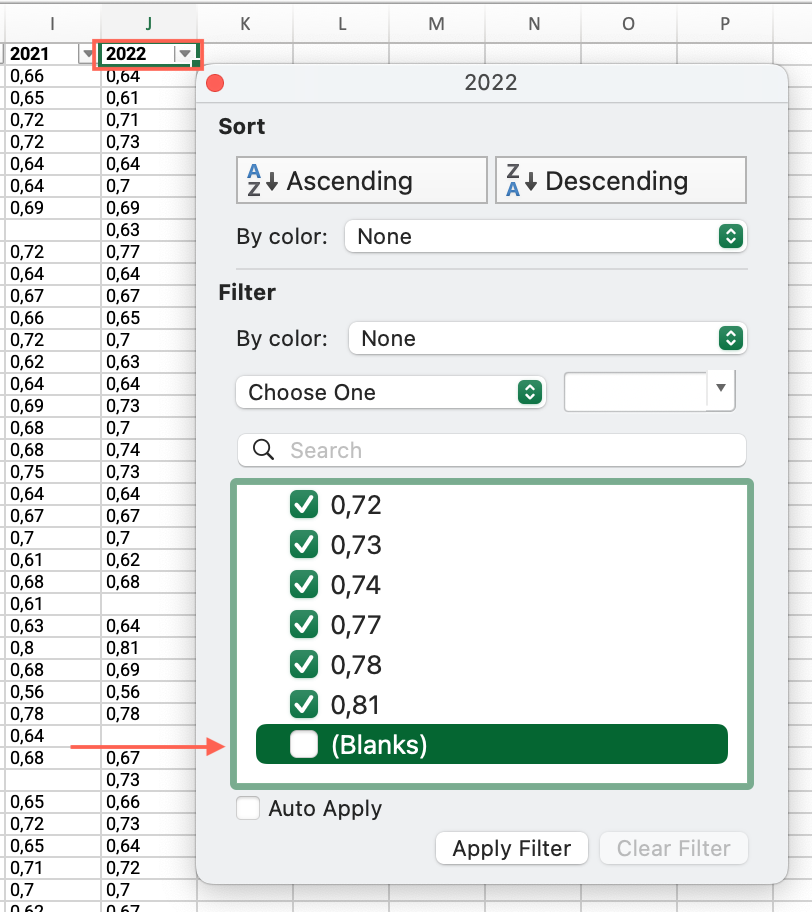
- Click and drag to select the entire range of cells under this column > See the average at the bottom of the sheet.
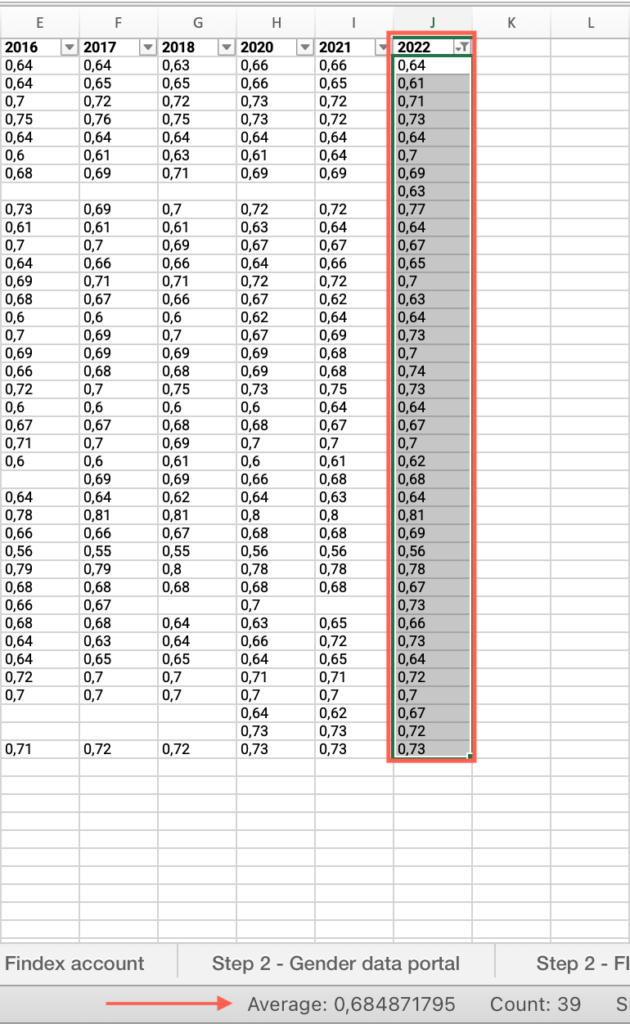
- Compare your country’s value with the average for your income group and answer the question on the platform.
Step 1: Is your country’s score on the overall Global Gender Gap Index below your regional group average?
- In the “Step 1 – WEF Gender Gap Index” sheet, locate the “Country” column > Check “Select all.”
- Locate the “Region” column > Filter by your regional group.
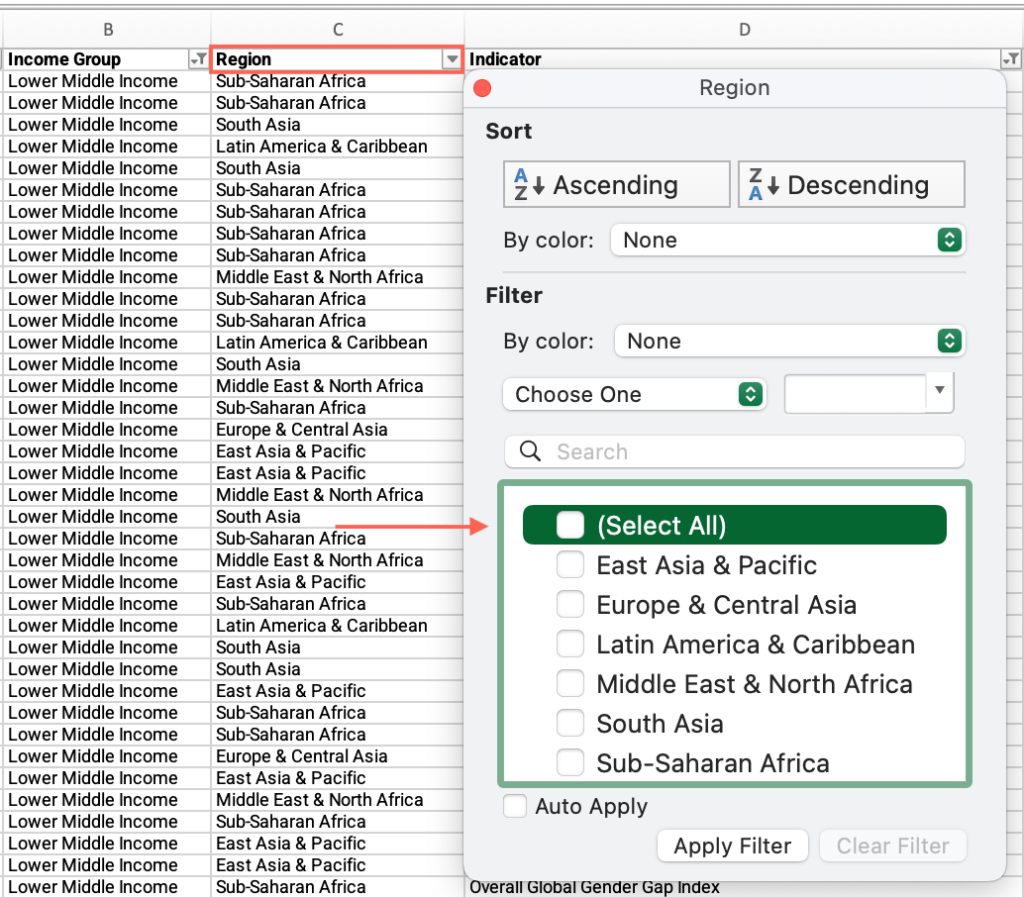
- Locate the “Indicator” column > Uncheck “Select all” > Check the box for the Overall Global Gender Gap Index indicator.
- Locate the column for your country’s latest available year > Apply the filter > Uncheck “Blanks.”
- Click and drag to select the entire range of cells under this column > See the average at the bottom of the sheet.
- Compare your country’s value with the average for your regional group and answer the question on the platform.
Step 1: Is your country’s score on the Economic Participation and Opportunity subindex below your income group average?
- In the “Step 1 – WEF Gender Gap Index” sheet, locate the “Country” column > Check “Select all.”
- Locate the “Income group” column > Filter by your income group.
- Locate the “Indicator” column > Uncheck “Select all” > Check the box for the Economic Participation and Opportunity subindex indicator.
- Locate the column for your country’s latest available year > Apply the filter > Uncheck “Blanks.”
- Click and drag to select the entire range of cells under this column > See the average at the bottom of the sheet.
- Compare your country’s value with the average for your income group and answer the question on the platform.
Step 1: Is your country’s score on the Economic Participation and Opportunity subindex below your regional group average?
- In the “Step 1 – WEF Gender Gap Index” sheet, locate the “Country” column > Check “Select all.”
- Locate the “Region” column > Filter by your regional group.
- Locate the “Indicator” column > Uncheck “Select all” > Check the box for the Economic Participation and Opportunity subindex indicator.
- Locate the column for your country’s latest available year > Apply the filter > Uncheck “Blanks.”
- Click and drag to select the entire range of cells under this column > See the average at the bottom of the sheet.
- Compare your country’s value with the average for your regional group and answer the question on the platform.
Step 2: How do you categorize the gender gap in account ownership in your country?
- In the “M10 – Step-by-step guide to analyze restrictive social norms – databases.xlsx” file, open the “Step 2 – Findex account” sheet.
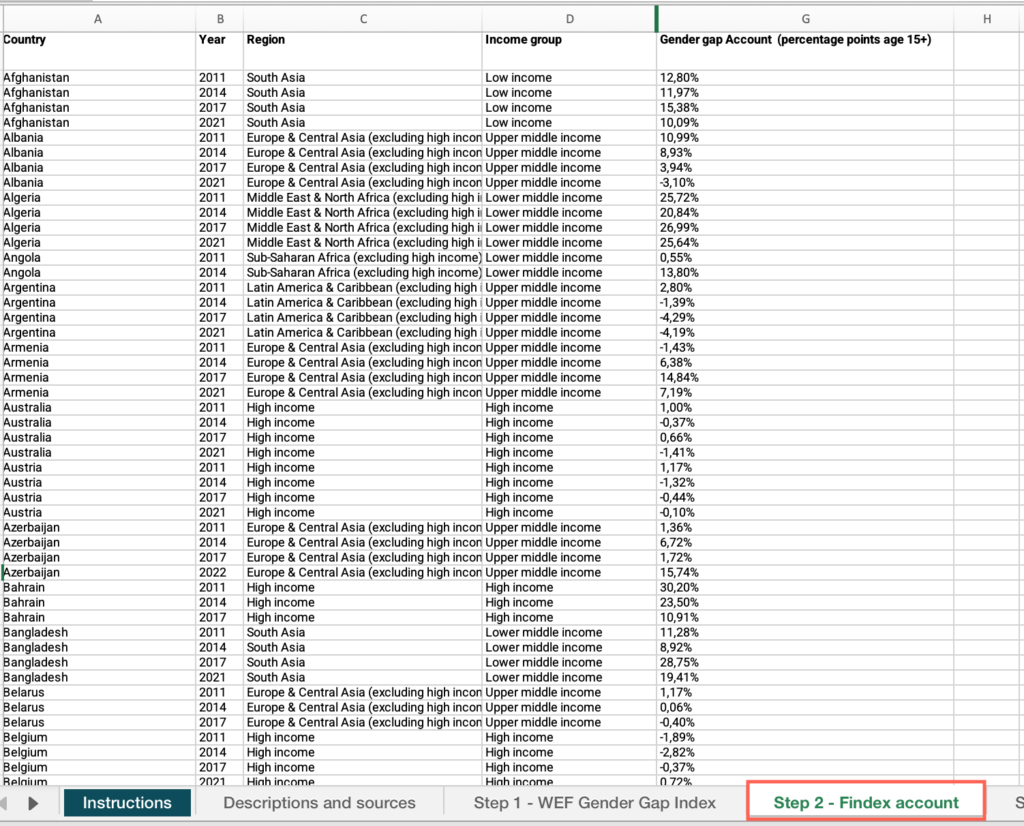
- Locate the “Country” column > Filter by your country.
- Locate the “Year” column > Filter by your country’s latest available year.
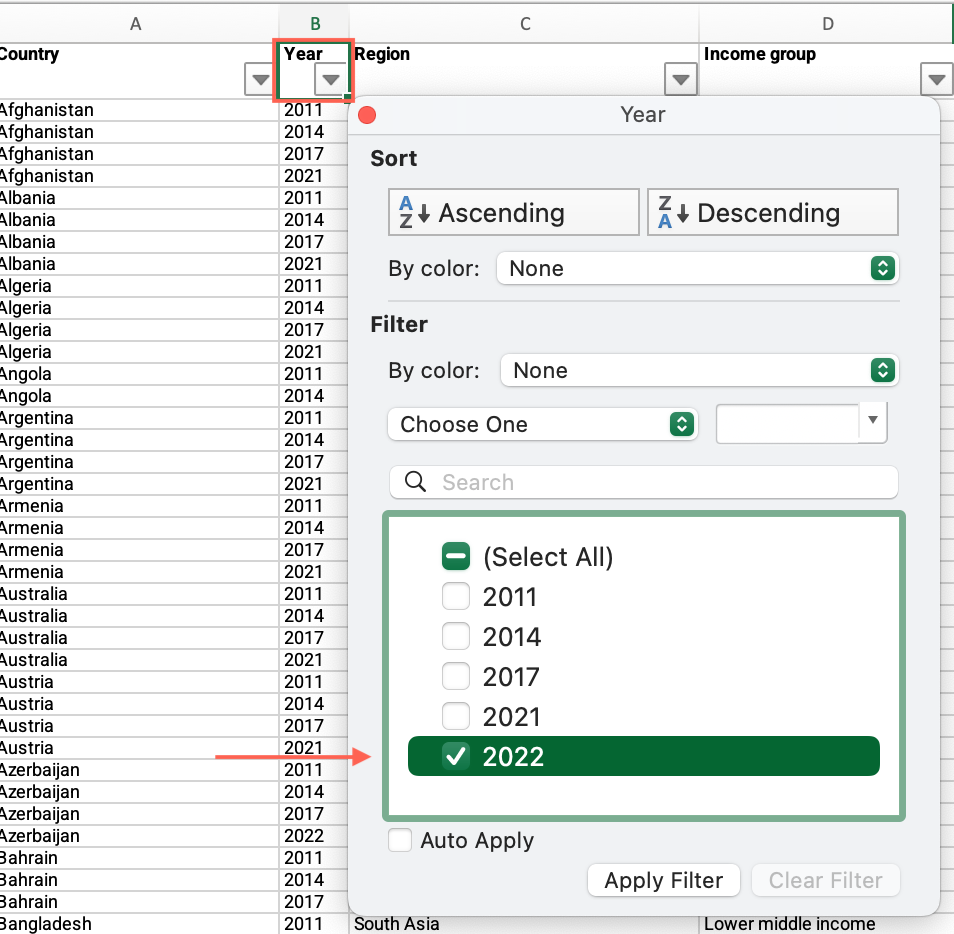
- Locate the “Gender gap Account (percentage points age 15+)” column > Find the value and answer the question on the platform.
Step 2: Is there a positive gender gap in the use of mobile phones or the internet for making digital payments between men and women?
- In the “M10 – Step-by-step guide to analyze restrictive social norms – databases.xlsx” file, open the “Step 2 – Gender data portal” sheet.
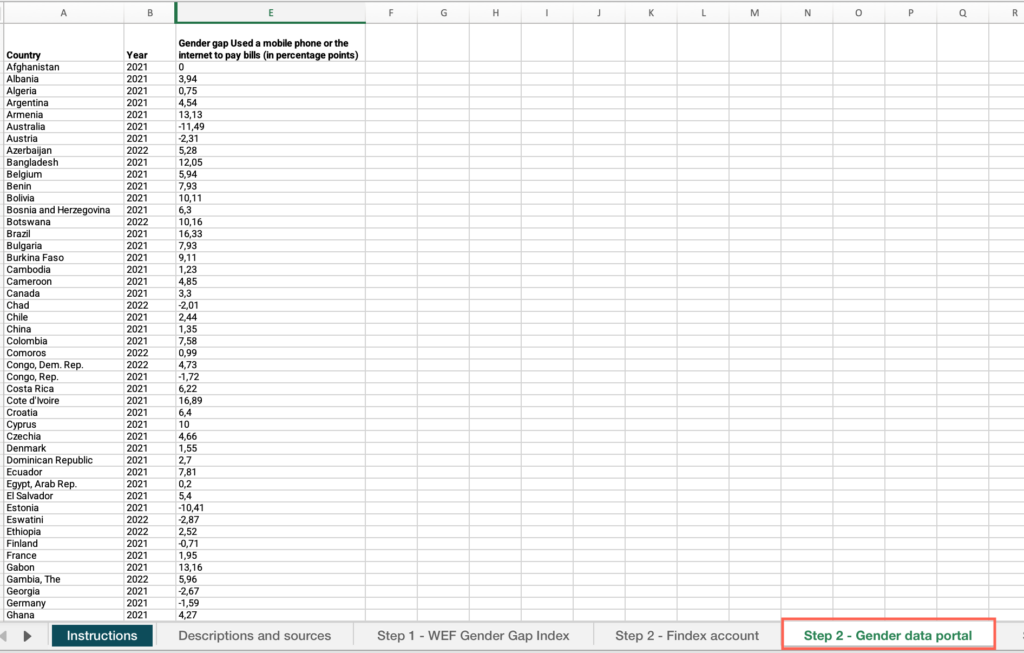
- Locate the “Country” column > Filter by your country.
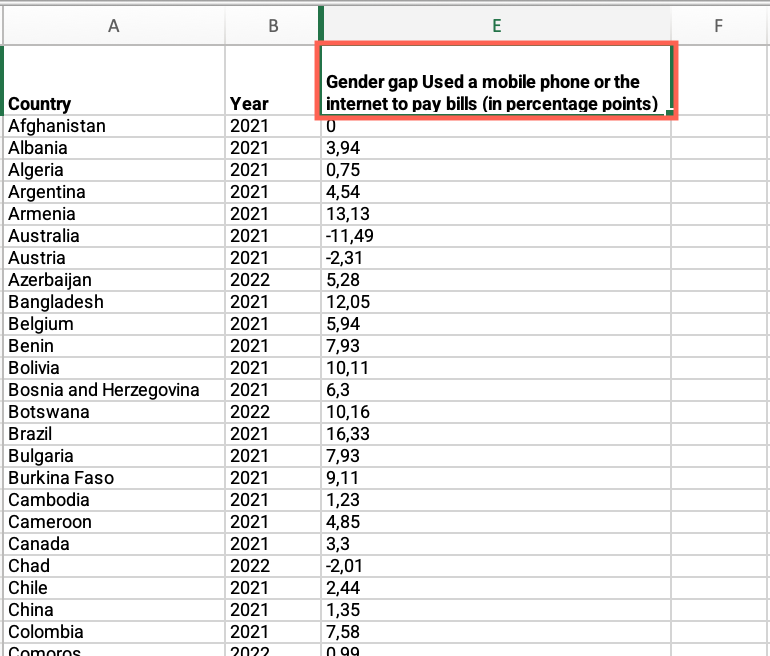
- Locate the “Gender gap Used a mobile phone or the internet to pay bills (in percentage points)” column > Find the value and answer the question on the platform.
Step 2: Is your country’s gender gap in account ownership above your income group average?
- In the “Step 2 – Gender data portal” sheet, locate the “Country” column > Apply the filter > Uncheck the box for your country > Check the box for your income group.
- Locate the “Gender gap Used a mobile phone or the internet to pay bills (in percentage points)” column > Find the value.
- Compare your country’s value with the average for your income group and answer the question on the platform.
Step 2: Is your country’s gender gap in account ownership above your regional group average?
- In the “Step 2 – Gender data portal” sheet, locate the “Country” column > Apply the filter > Uncheck the box for your country > Check the box for your regional group.
- Locate the “Gender gap Used a mobile phone or the internet to pay bills (in percentage points)” column > Find the value.
- Compare your country’s value with the average for your regional group and answer the question on the platform.
Step 2: Does your country have national strategy documents to promote the financial inclusion of women?
- In the “M10 – Step-by-step guide to analyze restrictive social norms – databases.xlsx” file, open the “Step 2 – FICP – FS & FI” sheet.
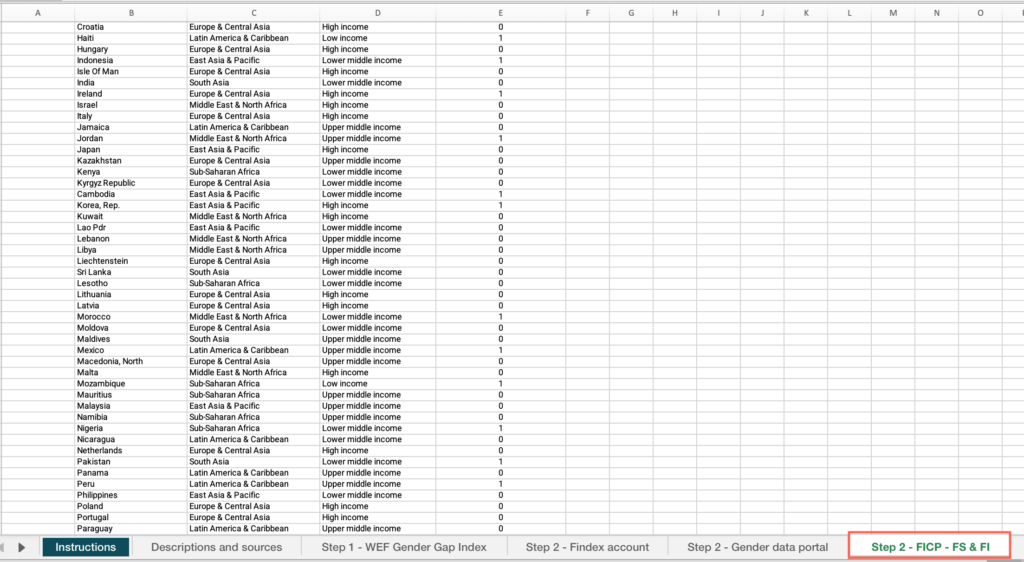
- Locate the “Country” column > Filter by your country.
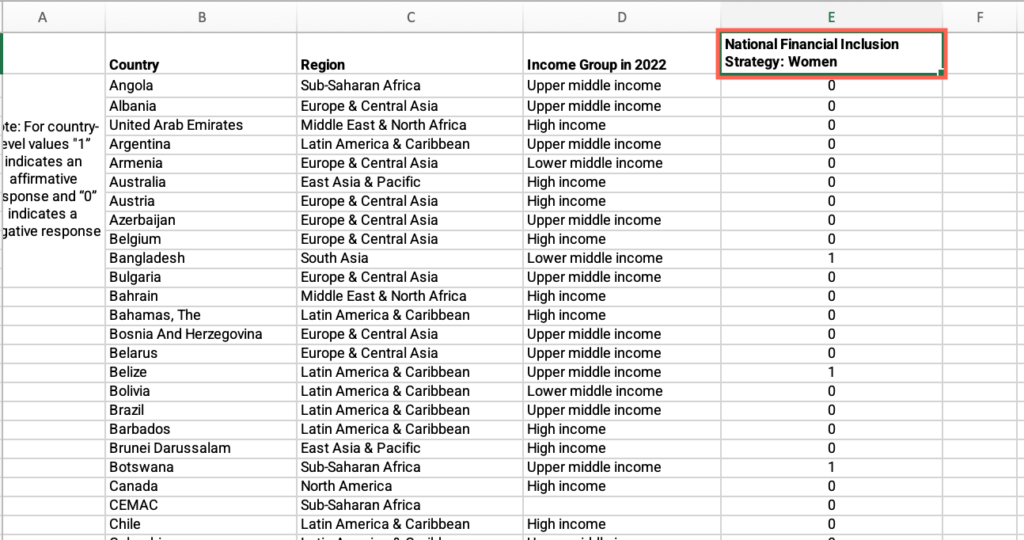
- Locate the “National Financial Inclusion Strategy: Women” column > Find the value and answer the question on the platform.
Step 3: Using the latest available data point, what is the gender gap in ID ownership in your country?
- In the “M10 – Step-by-step guide to analyze restrictive social norms – databases.xlsx” file, open the “Step 3 – ID4D” sheet.
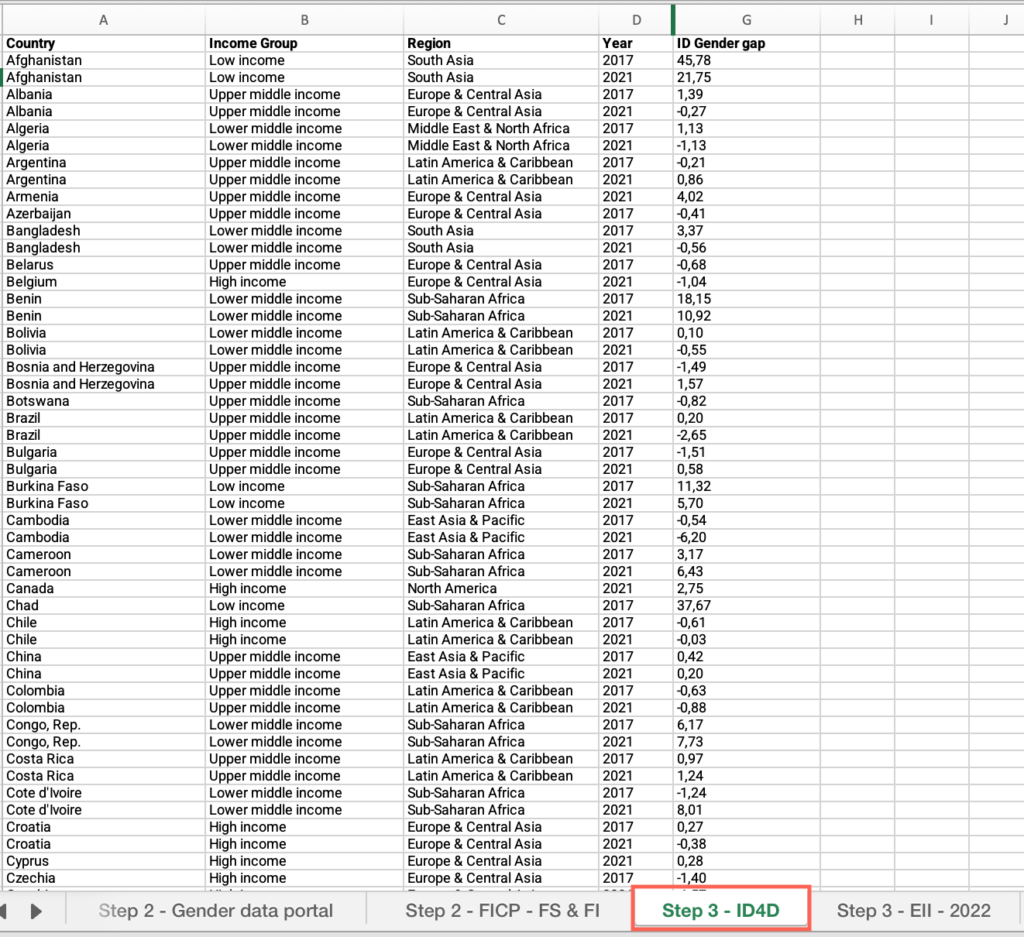
- Locate the “Country” column > Filter by your country.
- Locate the “Year” column > Filter by your country’s latest available year.
- Locate the “ID gender gap” column > Find the value and answer the question on the platform.
Step 3: Has there been any change from the 2017 data?
- In the “Step 3 – ID4D” sheet, locate the “Country” column > Filter by your country.
- Locate the “Year” column > Apply the filter > Check “Select all” > Find the values and answer the question on the platform.
Step 3: Is your country’s gender gap above the average for countries within the same income group?
- In the “Step 3 – ID4D” sheet, locate the “Country” column > Apply the filter > Check “Select all.”
- Locate the “Income group” column > Filter by your income group.
- Locate the “Year” column > Filter by your country’s latest available year.
- Locate the “ID gender gap” column > Apply the filter > Uncheck “Blanks.”
- Click and drag to select the entire range of cells under this column > See the average at the bottom of the sheet.
- Compare your country’s value with the average for your income group and answer the question on the platform.
Step 3: Is your country’s gender gap above the average for countries within the same geographical region?
- In the “Step 3 – ID4D” sheet, locate the “Country” column > Apply the filter > Check “Select all.”
- Locate the “Region” column > Filter by your regional group.
- Locate the “Year” column > Filter by your country’s latest available year.
- Locate the “ID gender gap” column > Apply the filter > Uncheck “Blanks.”
- Click and drag to select the entire range of cells under this column > See the average at the bottom of the sheet.
- Compare your country’s value with the average for your regional group and answer the question on the platform.
Step 3: What is your country’s gender gap in the last year of this series?
- In the “M10 – Step-by-step guide to analyze restrictive social norms – databases.xlsx” file, open the “Step 3 – EII – 2022” sheet.
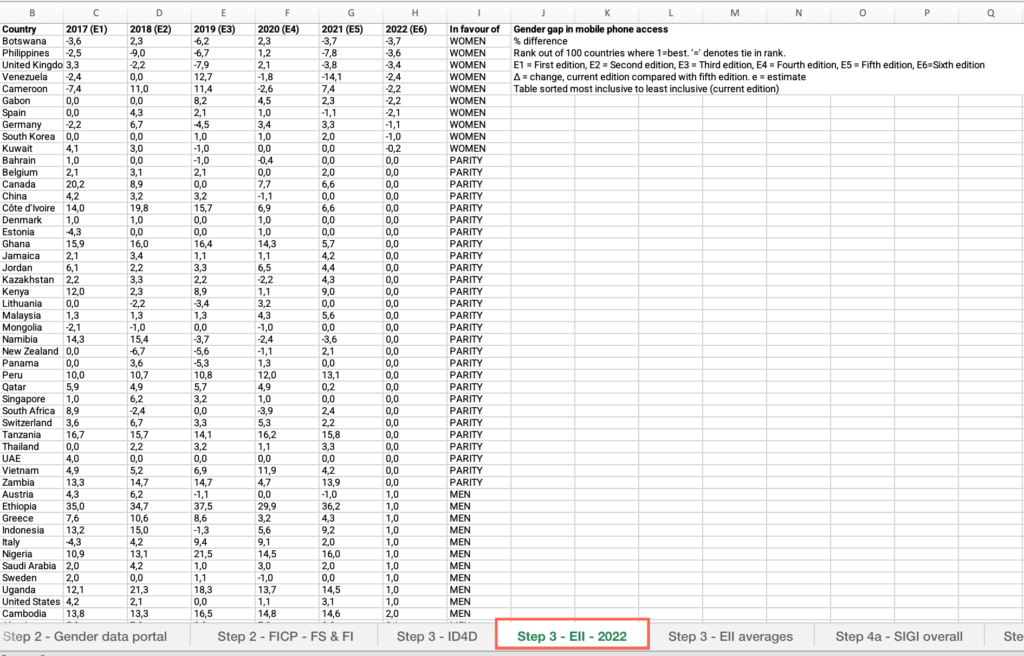
- Locate the “Country” column > Filter by your country.
- Move across columns to find the latest available year > Find the value and answer the question on the platform.
Step 3: How has the gap changed over the last 3 years with available data?
- In the “Step 3 – EII – 2022” sheet, locate the values for the previous three years and answer the question on the platform.
Step 3: Is your country’s gender gap below your income group average?
- In the “M10 – Step-by-step guide to analyze restrictive social norms – databases.xlsx” file, open the “Step 3 – EII averages” sheet.
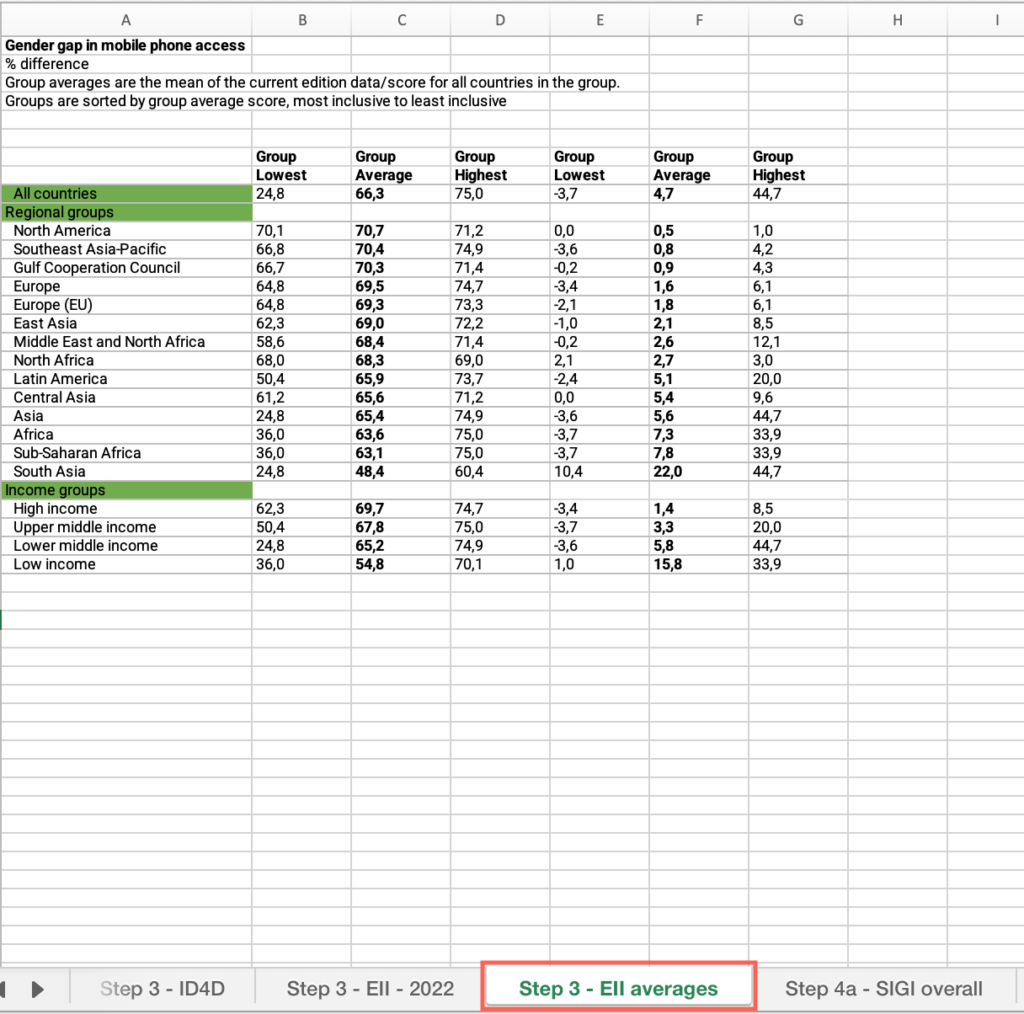
- Locate the “Income groups” cell > Locate your income group > Find the value and answer the question on the platform.
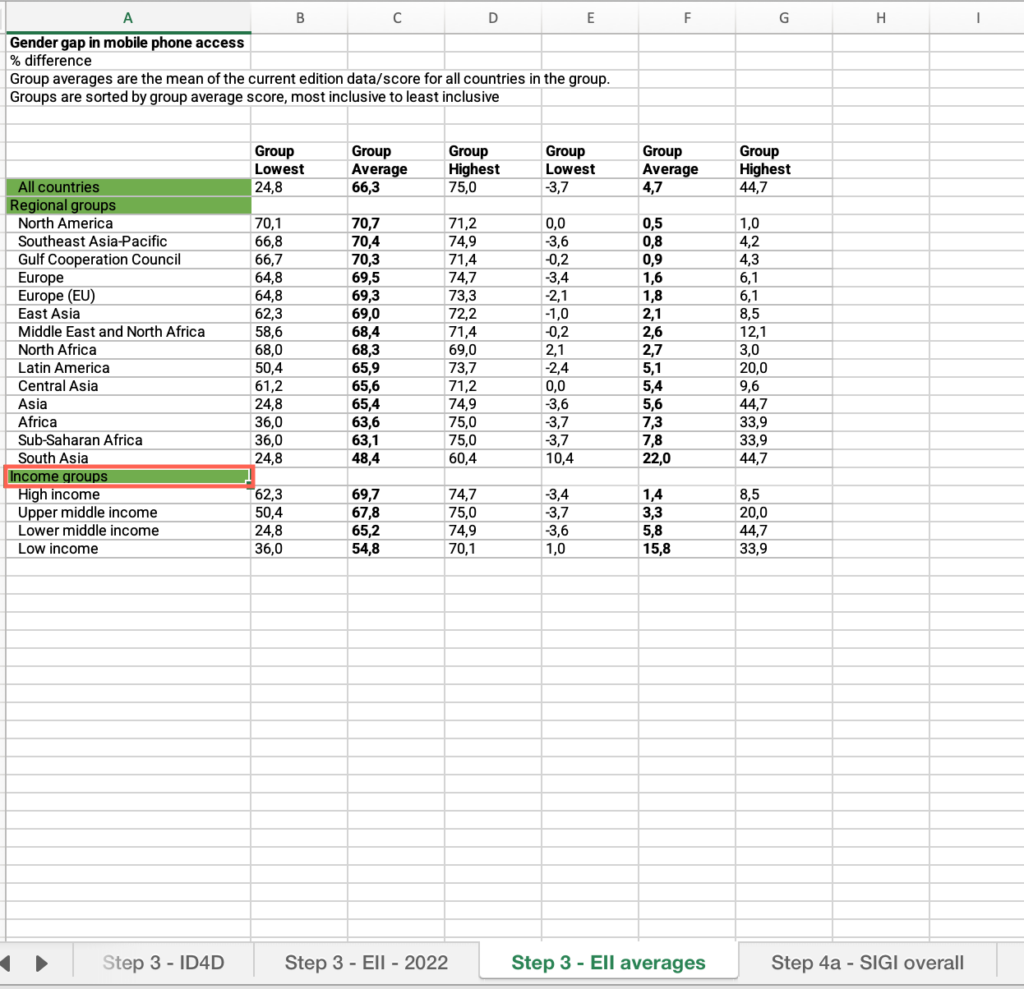
Step 3: Is your country’s gender gap below your regional group average?
- In the “Step 3 – EII averages” sheet, locate the “Regional groups” cell > Locate your regional group > Find the value and answer the question on the platform.
Step 4a: What is your country’s overall score on the most recent available version of the SIGI Index?
- In the “M10 – Step-by-step guide to analyze restrictive social norms – databases.xlsx” file, open the “Step 4a – SIGI overall” sheet.
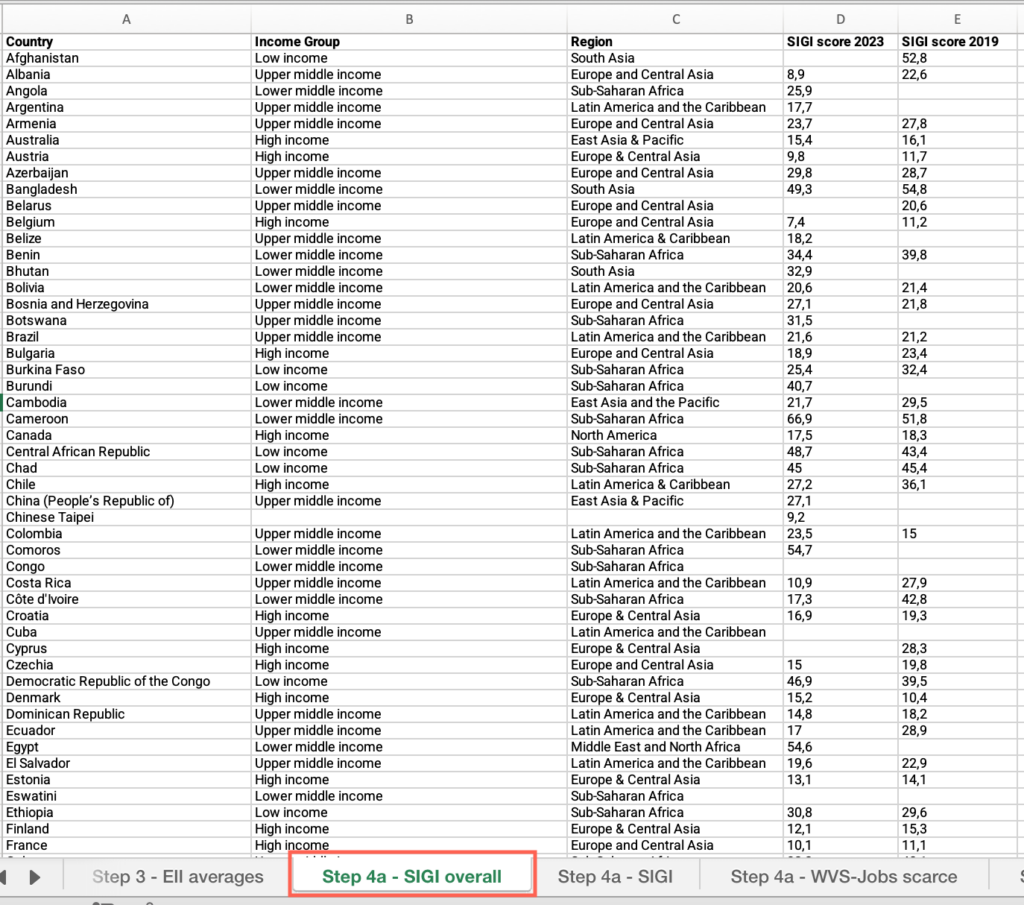
- Locate the “Country” column > Filter by your country.
- Move across columns to find your country’s latest available year > Find the value and answer the question on the platform.
Step 4a: How has your country’s score evolved from the previous edition of the SIGI Index?
- In the “Step 4a – SIGI overall” sheet, locate the “Country” column > Filter by your country.
- Move across columns to find your country’s scores for the two available years > Find the values and answer the question on the platform.
Step 4a: Is your country’s score above your income group average?
- In the “Step 4a – SIGI overall” sheet, locate the “Country” column > Apply the filter > Check “Select all.”
- Locate the “Income group” column > Filter by your income group.
- Locate the column for your country’s latest available year > Apply the filter > Uncheck “Blanks.”
- Click and drag to select the entire range of cells under this column > See the average at the bottom of the sheet.
- Compare your country’s value with the average for your income group and answer the question on the platform.
Step 4a: Is your country’s score above your regional group average?
- In the “Step 4a – SIGI overall” sheet, locate the “Country” column > Apply the filter > Check “Select all.”
- Locate the “Region” column > Filter by your regional group.
- Locate the column for your country’s latest available year > Apply the filter > Uncheck “Blanks.”
- Click and drag to select the entire range of cells under this column > See the average at the bottom of the sheet.
- Compare your country’s value with the average for your regional group and answer the question on the platform.
Step 4a: Do more than 30% of respondents display discriminatory attitudes on women’s work and children?
- In the “M10 – Step-by-step guide to analyze restrictive social norms – databases.xlsx” file, open the “Step 4a – SIGI” sheet.
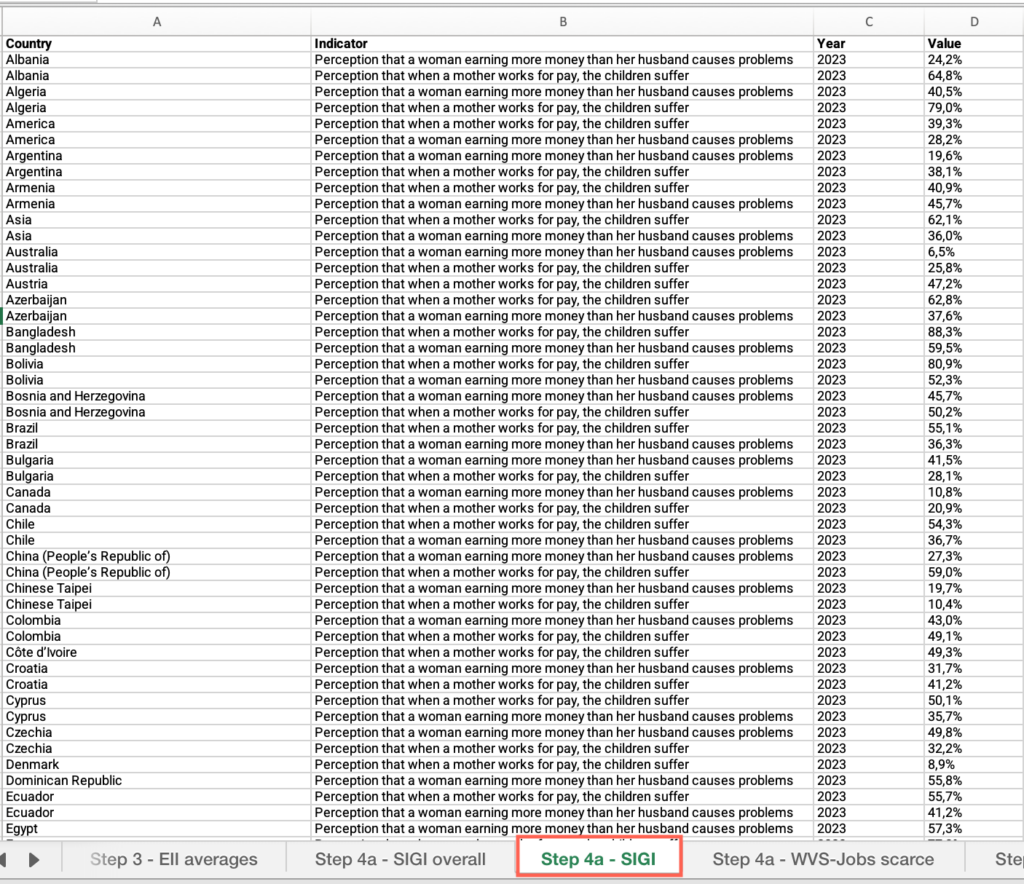
- Locate the “Indicator” column > Apply the filter > Check “Perception that when a mother works for pay, the children suffer.”
- Locate the “Value” column > Answer the question on the platform.
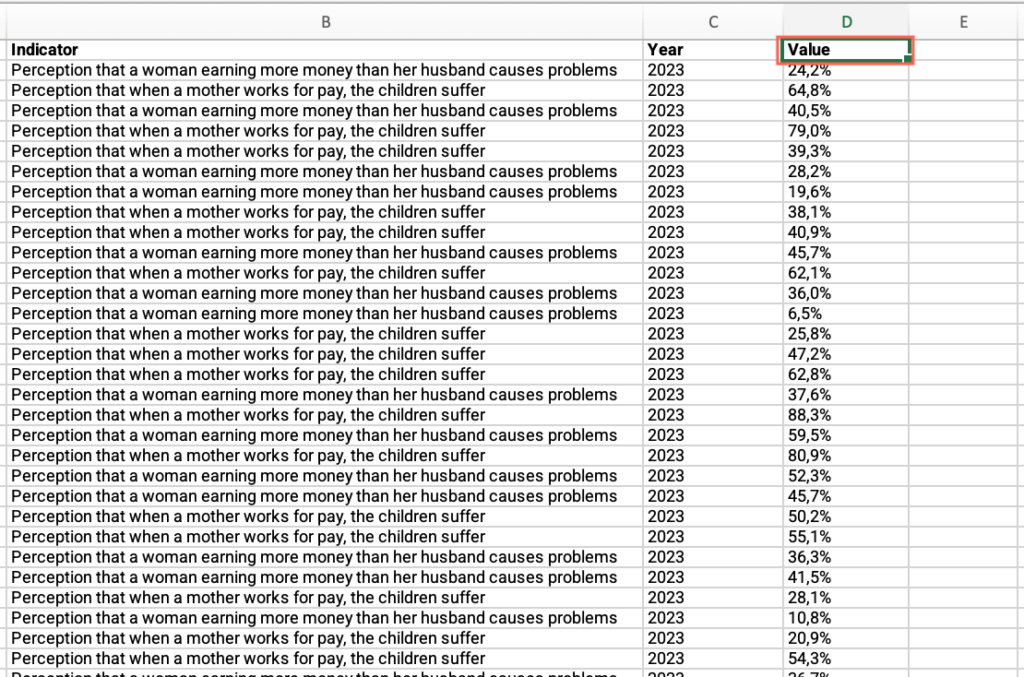
Step 4a: Do more than 20% of respondents display discriminatory attitudes on women’s income?
- In the “Step 4a – SIGI” sheet, locate the “Indicator” column > Apply the filter > Check “Perception that a woman earning more money than her husband causes problems.”
- Locate the “Value” column > Answer the question on the platform.
Step 4a: Men should have more right to a job than women
- In the “M10 – Step-by-step guide to analyze restrictive social norms – databases.xlsx” file, open the “Step 4a – WVS-Jobs scarce” sheet.
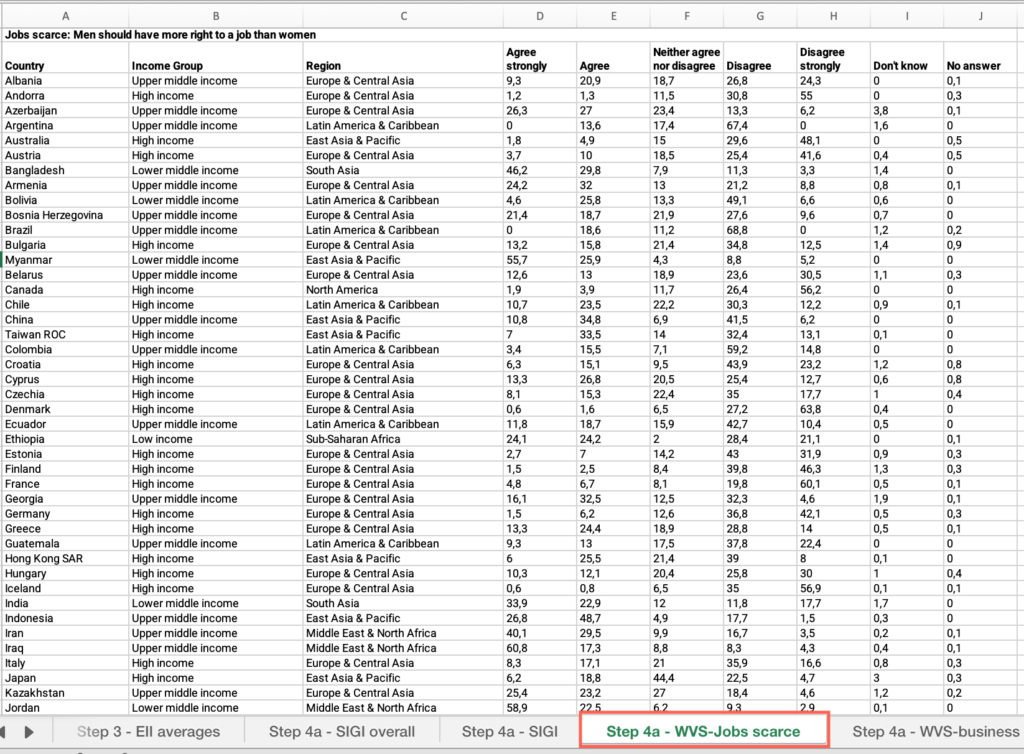
- Locate the “Country” column > Filter by your country.
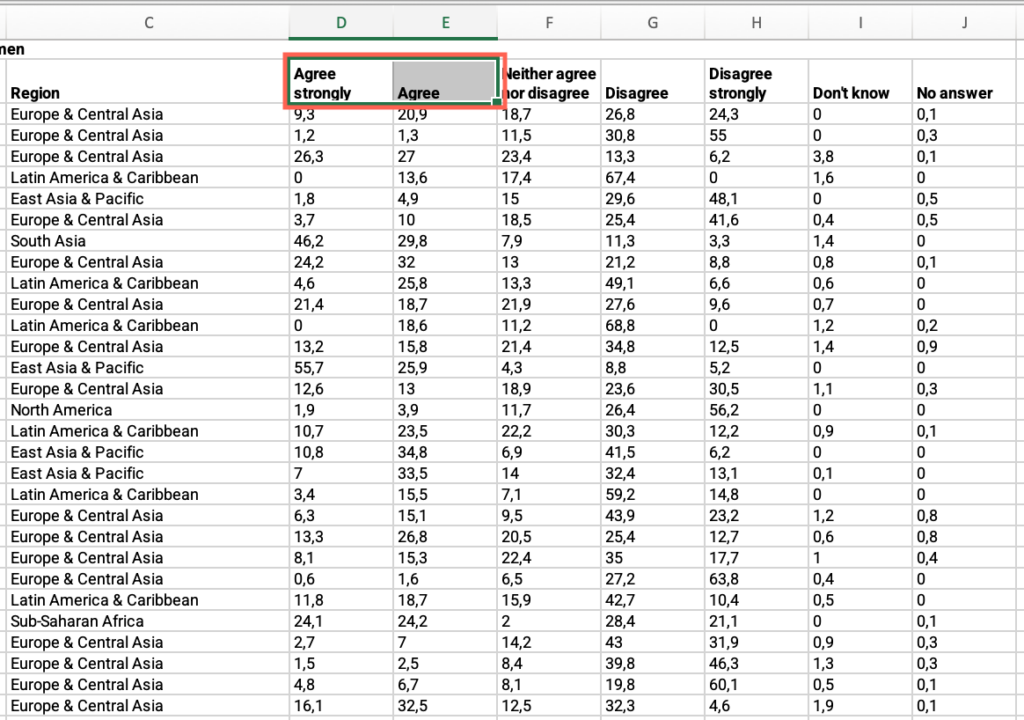
- Locate the “Agree” and “Agree strongly” columns > Find and add the values > Answer the question on the platform.
Step 4a: Men make better business executives than women do
- In the “M10 – Step-by-step guide to analyze restrictive social norms – databases.xlsx” file, open the “Step 4a – WVS-business ex.” sheet.
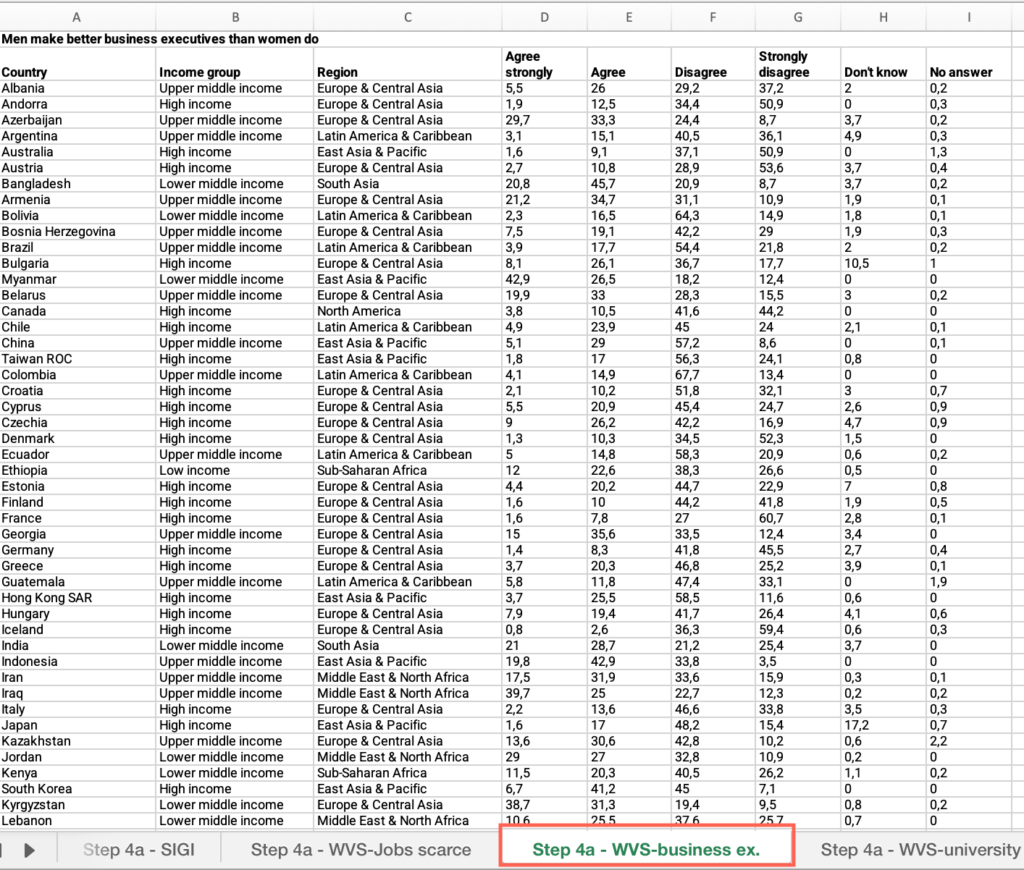
- Locate the “Country” column > Filter by your country.
- Locate the “Agree” and “Agree strongly” columns > Find and add the values > Answer the question on the platform.
Step 4a: University is more important for boys than for girls
- In the “M10 – Step-by-step guide to analyze restrictive social norms – databases.xlsx” file, open the “Step 4a – WVS-university” sheet.
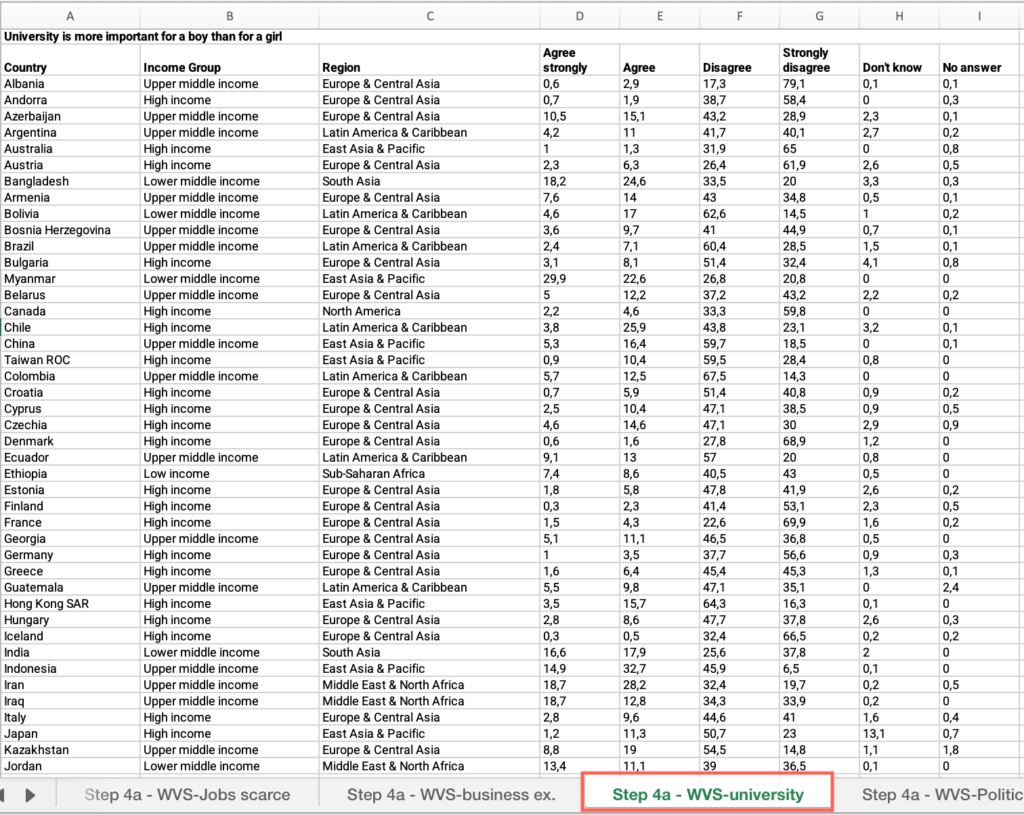
- Locate the “Country” column > Filter by your country.
- Locate the “Agree” and “Agree strongly” columns > Find and add the values > Answer the question on the platform.
Step 4a: Men make better political leaders
- In the “M10 – Step-by-step guide to analyze restrictive social norms – databases.xlsx” file, open the “Step 4a – WVS-political leaders” sheet.
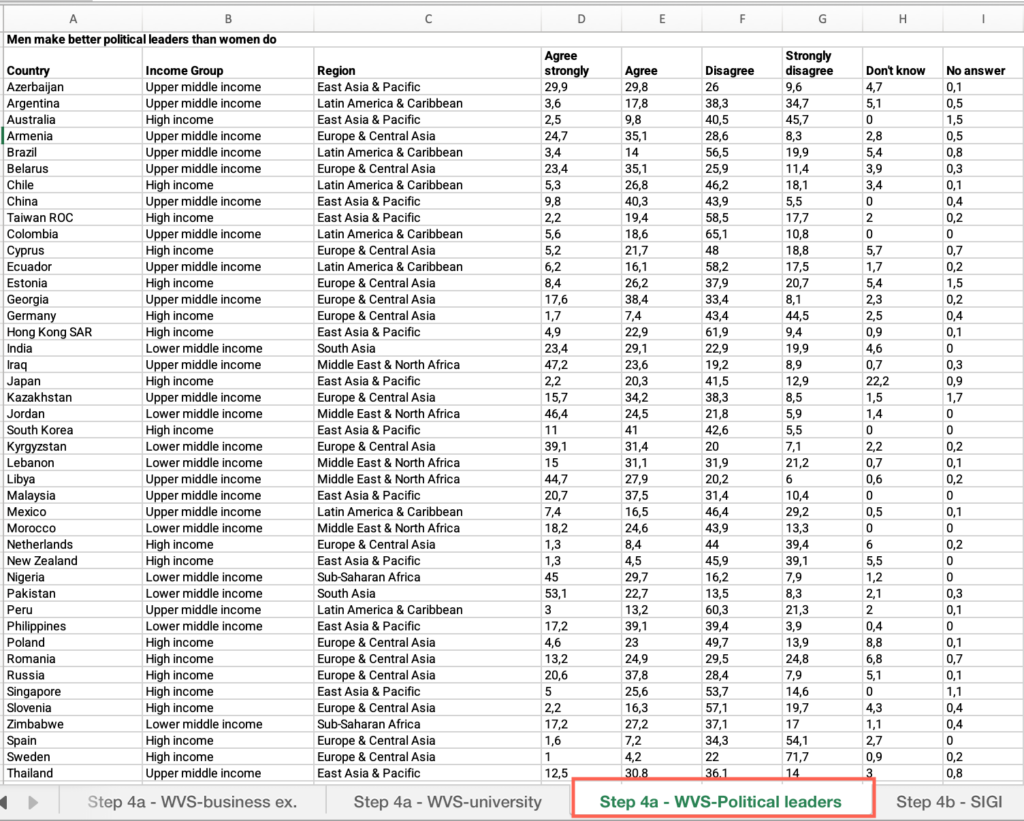
- Locate the “Country” column > Filter by your country.
- Locate the “Agree” and “Agree strongly” columns > Find and add the values > Answer the question on the platform.
Step 4a: Is your country’s gender bias above your income group average?
- In the “M10 – Step-by-step guide to analyze restrictive social norms – databases.xlsx” file, open the sheet(s) corresponding to the indicator(s) where more than 10% of the population agree or strongly agree.
- Locate the “Country” column > Apply the filter > Check “Select all.”
- Locate the “Income group” column > Filter by your income group.
- Locate the “Agree” column > Apply the filter > Uncheck “Blanks.”
- Click and drag to select the entire range of cells under this column > See the average at the bottom of the sheet.
- Locate the “Agree strongly” column > Apply the filter > Uncheck “Blanks.”
- Click and drag to select the entire range of cells under this column > See the average at the bottom of the sheet.
- Find and add the values > Compare your country’s value with the average for your income group and answer the question on the platform.
Step 4a: Is your country’s gender bias above your regional group average?
- In the “M10 – Step-by-step guide to analyze restrictive social norms – databases.xlsx” file, open the sheet(s) corresponding to the indicator(s) where more than 10% of the population agree or strongly agree.
- Locate the “Country” column > Apply the filter > Check “Select all.”
- Locate the “Region” column > Filter by your regional group.
- Locate the “Agree” column > Apply the filter > Uncheck “Blanks.”
- Click and drag to select the entire range of cells under this column > See the average at the bottom of the sheet.
- Locate the “Agree strongly” column > Apply the filter > Uncheck “Blanks.”
- Click and drag to select the entire range of cells under this column > See the average at the bottom of the sheet.
- Find and add the values > Compare your country’s value with the average for your regional group and answer the question on the platform.
Step 4b: Are there informal laws (customary, traditional or religious laws/rules) that create different rights or abilities between male and female surviving spouses when it comes to opening a bank account?
- In the “M10 – Step-by-step guide to analyze restrictive social norms – databases.xlsx” file, open the “Step 4b – SIGI” sheet.
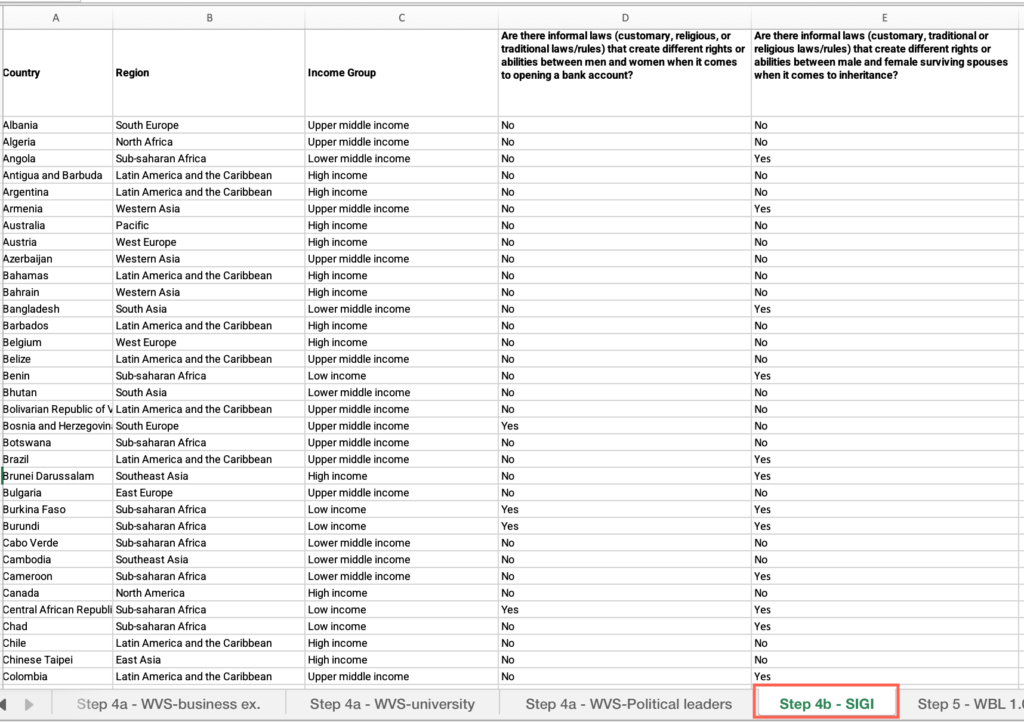
- Locate the “Country” column > Filter by your country.
- Locate the “Are there informal laws (customary, religious, or traditional laws/rules) that create different rights or abilities between men and women when it comes to opening a bank account?” column > Find the value and answer the question on the platform.
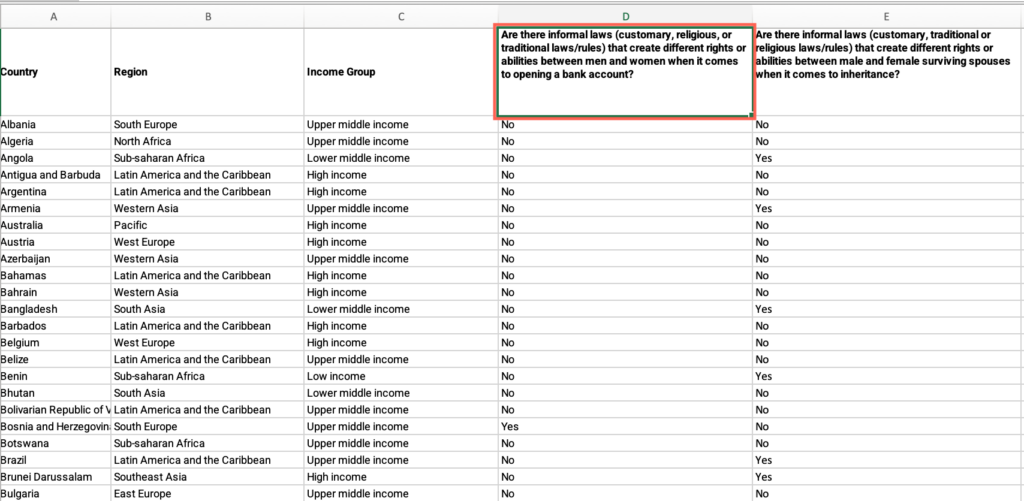
Step 4b: Are there informal laws (customary, religious, or traditional laws/rules) that create different rights or abilities between men and women when it comes to inheritance?
- In the “Step 4b – SIGI” sheet, locate the “Country” column > Filter by your country.
- Locate the “Are there informal laws (customary, traditional or religious laws/rules) that create different rights or abilities between male and female surviving spouses when it comes to inheritance?” column > Find the value and answer the question on the platform.
Step 5: Are there legal restrictions that specifically impact on women’s financial activities or access to financial services?
- In the “M10 – Step-by-step guide to analyze restrictive social norms – databases.xlsx” file, open the “Step 5 – WBL 1.0” sheet.
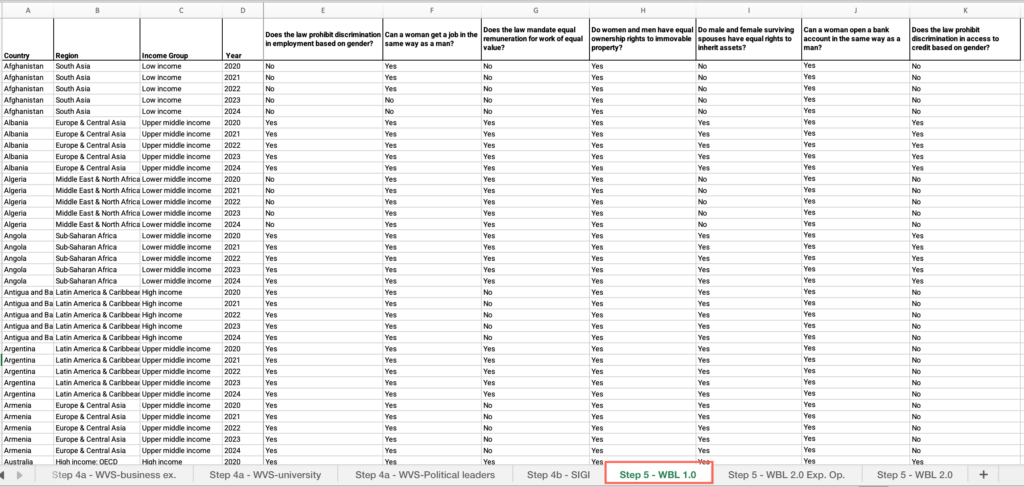
- Locate the “Country” column > Filter by your country.
- Locate the “Does the law prohibit discrimination in employment based on gender?” column > Find the value and answer the question on the platform.
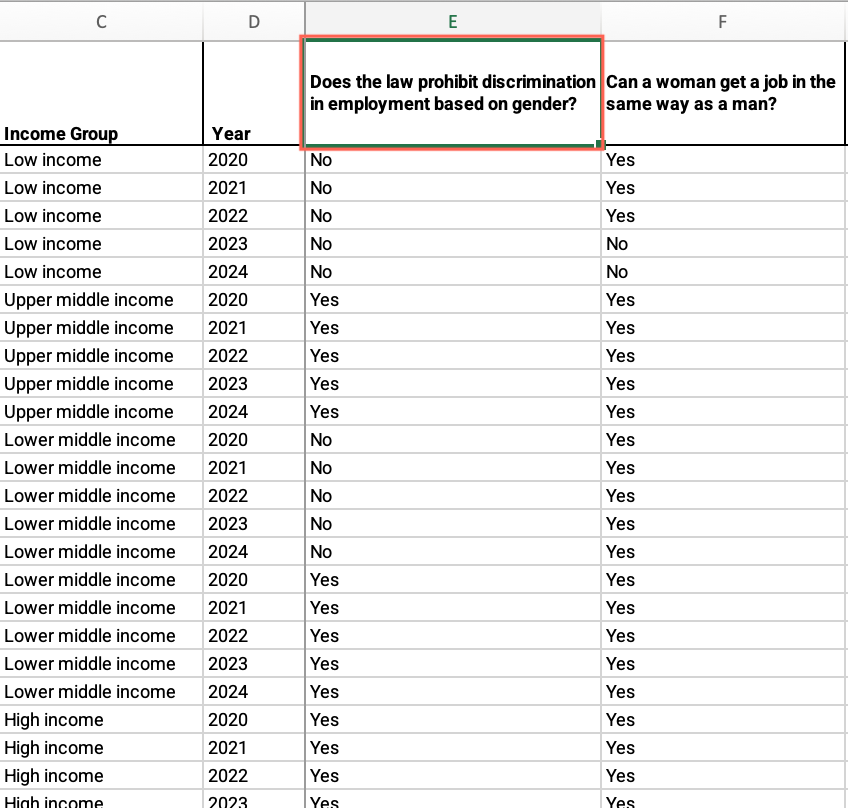
- Repeat these steps for each of the questions in the “Step 5 – WBL 1.0” sheet.
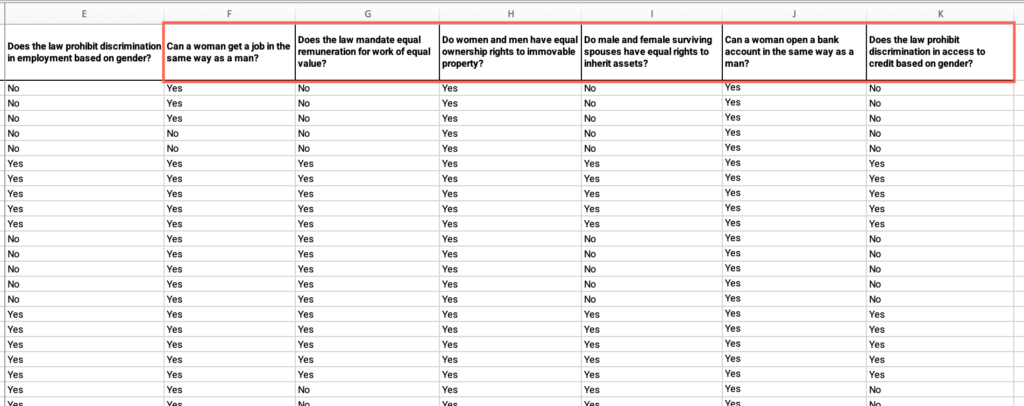
- For the last question: In the “M10 – Step-by-step guide to analyze restrictive social norms – databases.xlsx” file, open the “Step 5 – WBL 2.0 Exp. Op.” sheet.
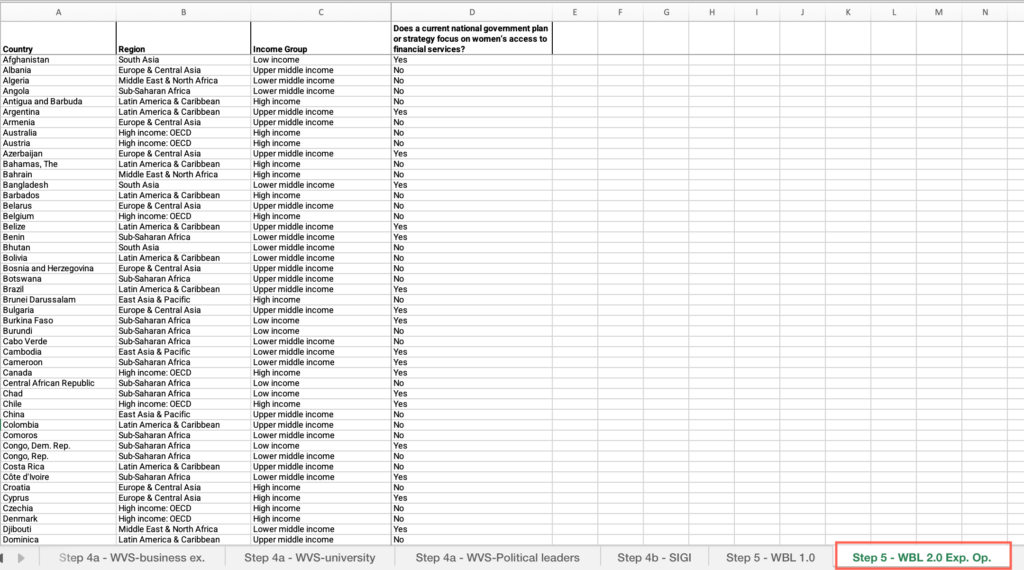
- Locate the “Country” column > Filter by your country.
- Locate the “Does a current national government plan or strategy focus on women’s access to financial services?” column > Find the value and answer the question on the platform.
Step 5: How does your country score in the overall WBL 2024 EO 2.0 index?
- In the “M10 – Step-by-step guide to analyze restrictive social norms – databases.xlsx” file, open the “Step 5 – WBL 2.0” sheet.
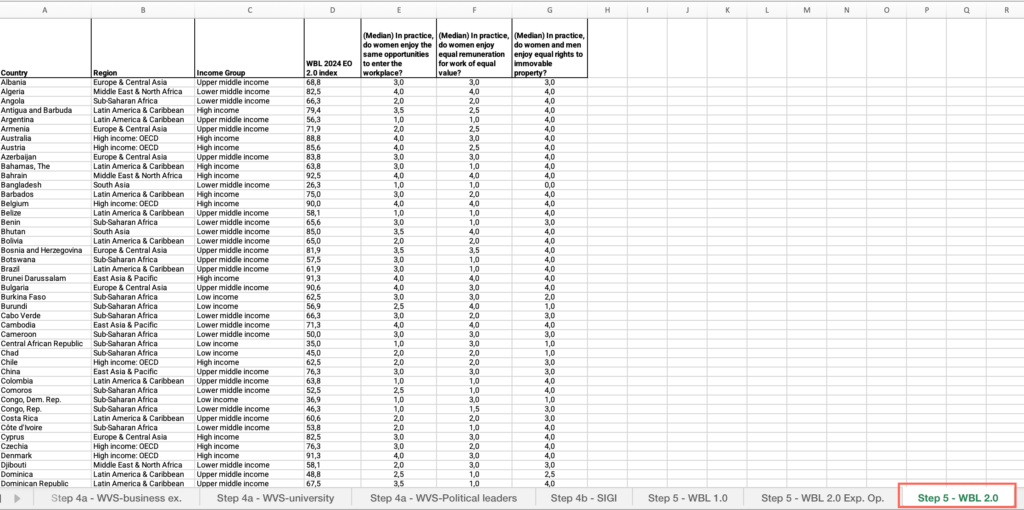
- Locate the “Country” column > Filter by your country.
- Locate the “WBL 2024 EO 2.0 index” column > Find the value and answer the question on the platform.
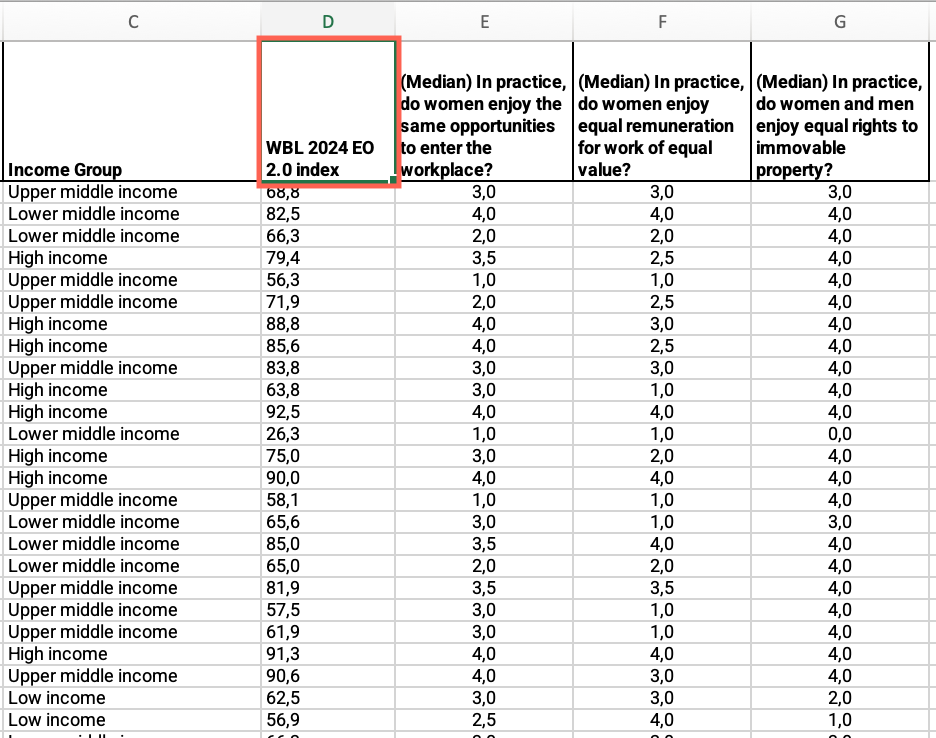
Step 5: How does your country score in the following questions?
- In the “Step 5 – WBL 2.0” sheet, locate the “Country” column > Filter by your country.
- Locate the “(Median) In practice, do women enjoy the same opportunities to enter the workplace?” column > Find the value and answer the question on the platform.
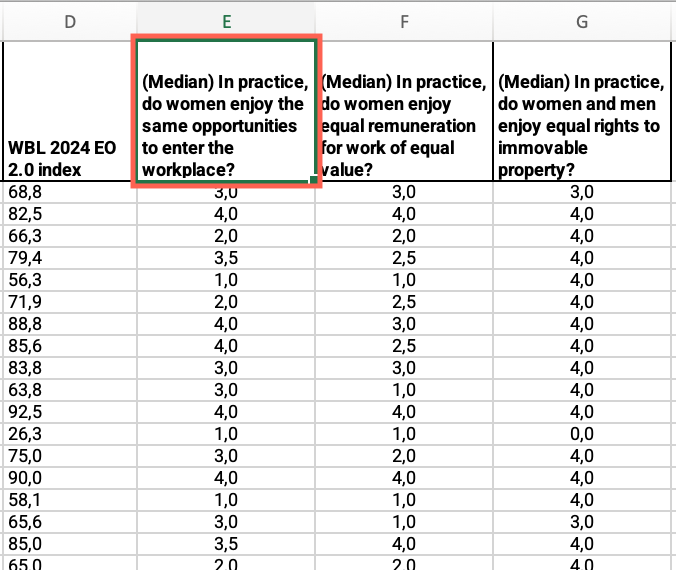
- Repeat these steps for each of the questions in the “Step 5 – WBL 2.0” sheet.
