Module 1 Assignment – Excel Tutorials
The following tutorial is an optional resource meant to assist you in navigating the databases and collecting the necessary data for your analysis.
Note on recording your responses: In the assignment you will find all the necessary fields to record your answers and the data you collect. You will also find an optional Answer Sheet Excel file to keep record of the collected data and your findings. You will find this file in the assignment’s introduction.
Step 1: Select a country
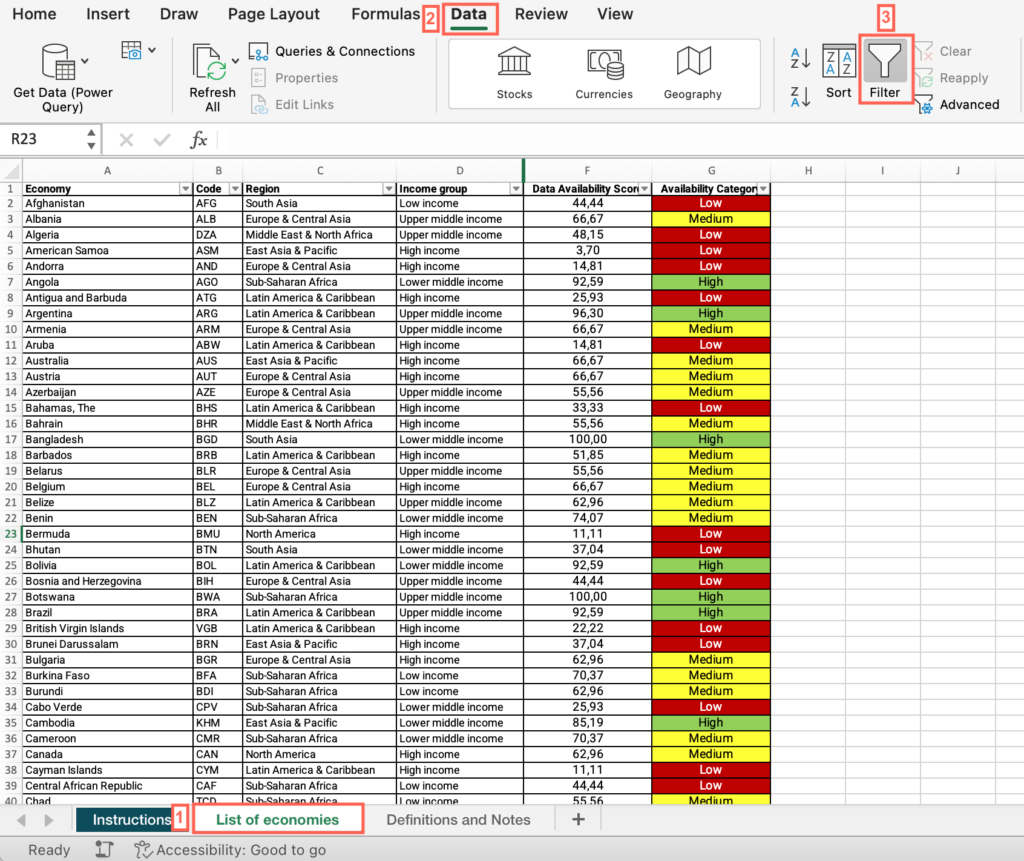
- Open the World Bank Country Classification Excel file > Open the “List of economies” sheet > Select the header row > Click the Data menu > Select “Filter”.
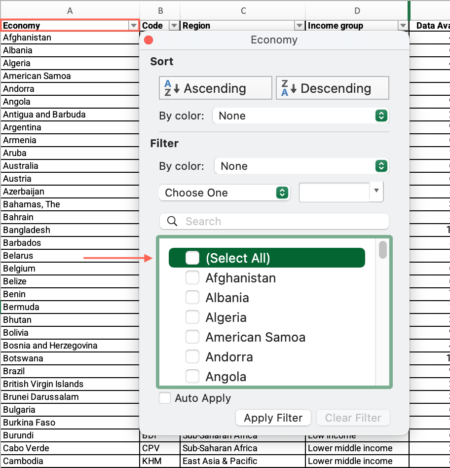
2. Now that “Filter” is enabled, click on the dropdown arrow in the “Economy” column header > Uncheck “Select All” > Check the box for your country.
3. Locate the “Availability category” column > Find your country’s data availability classification.
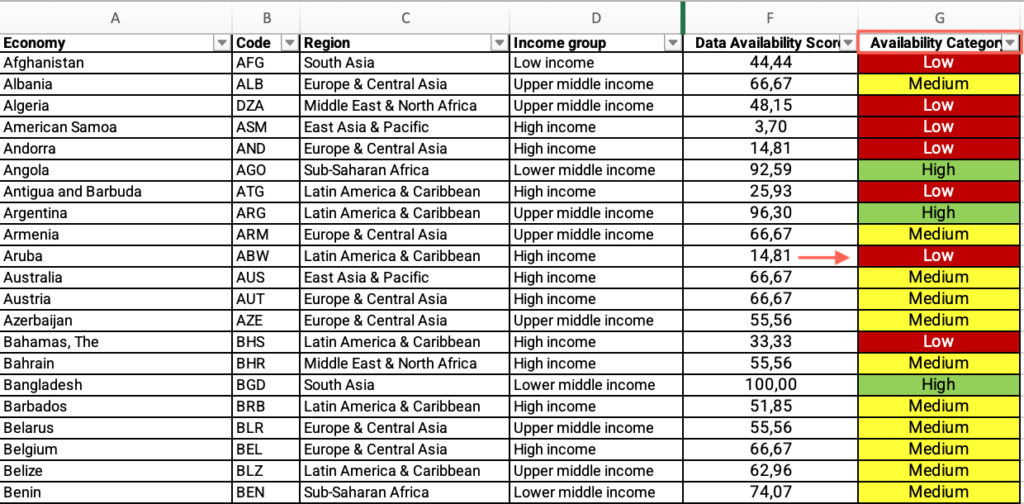
- If your country is marked in red or yellow, refer to the “What to do if data is missing” section.
- Select your chosen country from the dropdown menu on the platform.
Step 1: What is your country’s income and regional group?
- Open the World Bank Country Classification Excel file > Open the “List of economies” sheet.
- Locate the “Economy” column > Apply the filter > Uncheck “Select all” > Filter by your country.
- Locate the “Region” column > Find your country’s region and answer the question on the platform.
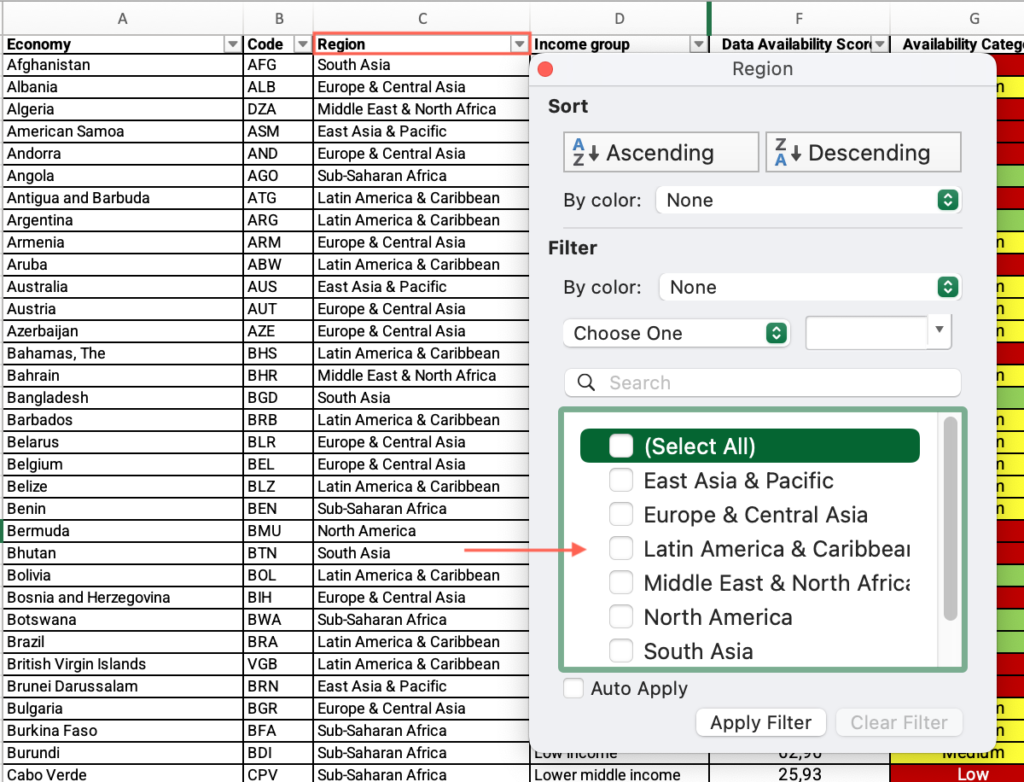
- Locate the “Income group” column > Find your country’s income group and answer the question on the platform.
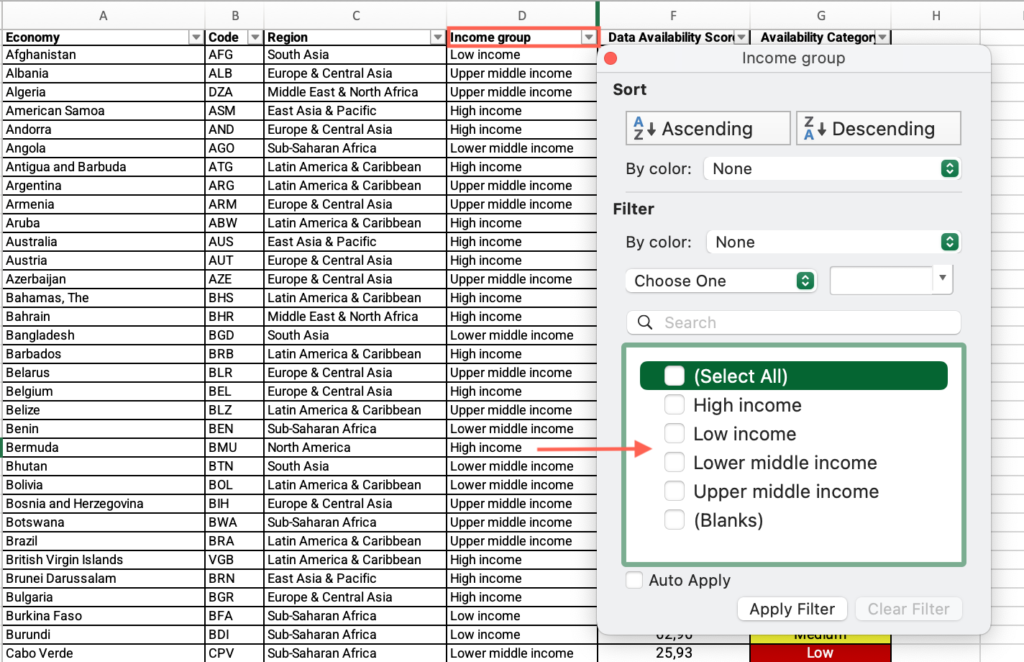
Step 2: What types of financial institutions exist in your country?
- In the M1 – What is the situation of financial inclusion-databases Excel file, open the “Step 2– FICP-FS&FI” sheet.
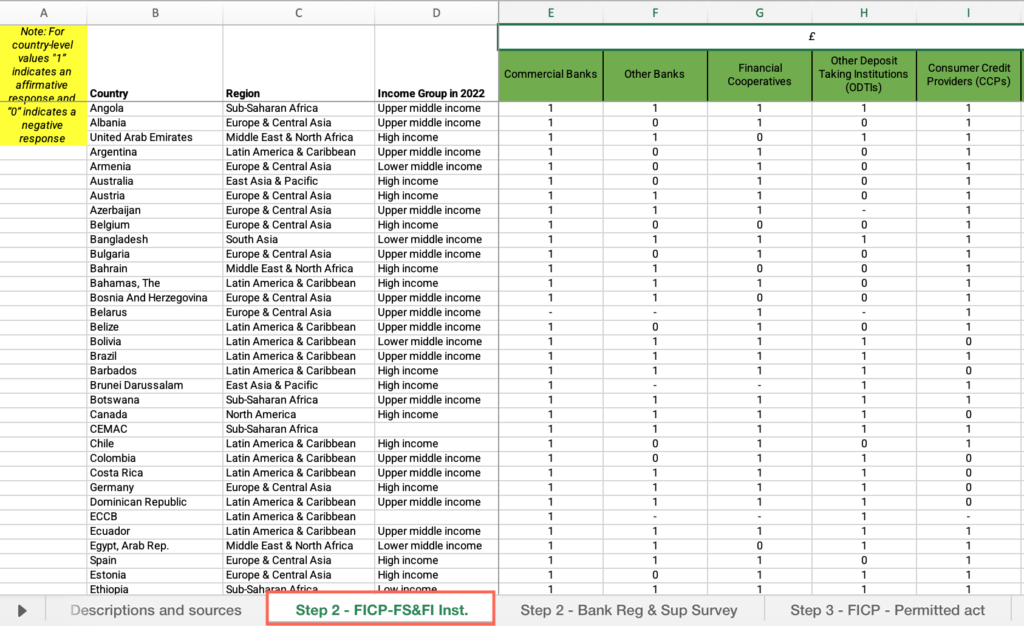
- Right-click on the status bar at the bottom of the Excel window > In the dialog box that appears, ensure that the checkbox for “Average” is checked.
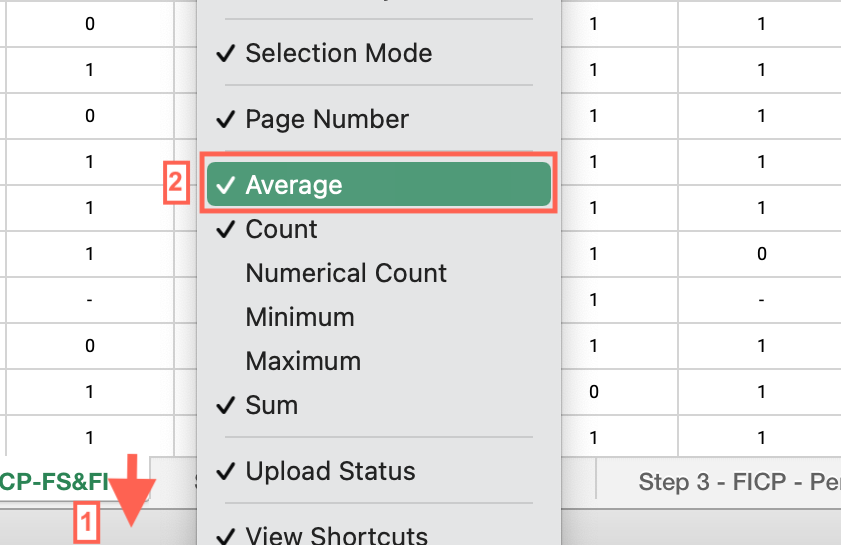
- Select the header row > click the Data menu > Select “Filter.”

- Now that “Filter” is enabled, click on the dropdown arrow in the “Country” column header > Uncheck “Select all” > Check the box for your country.
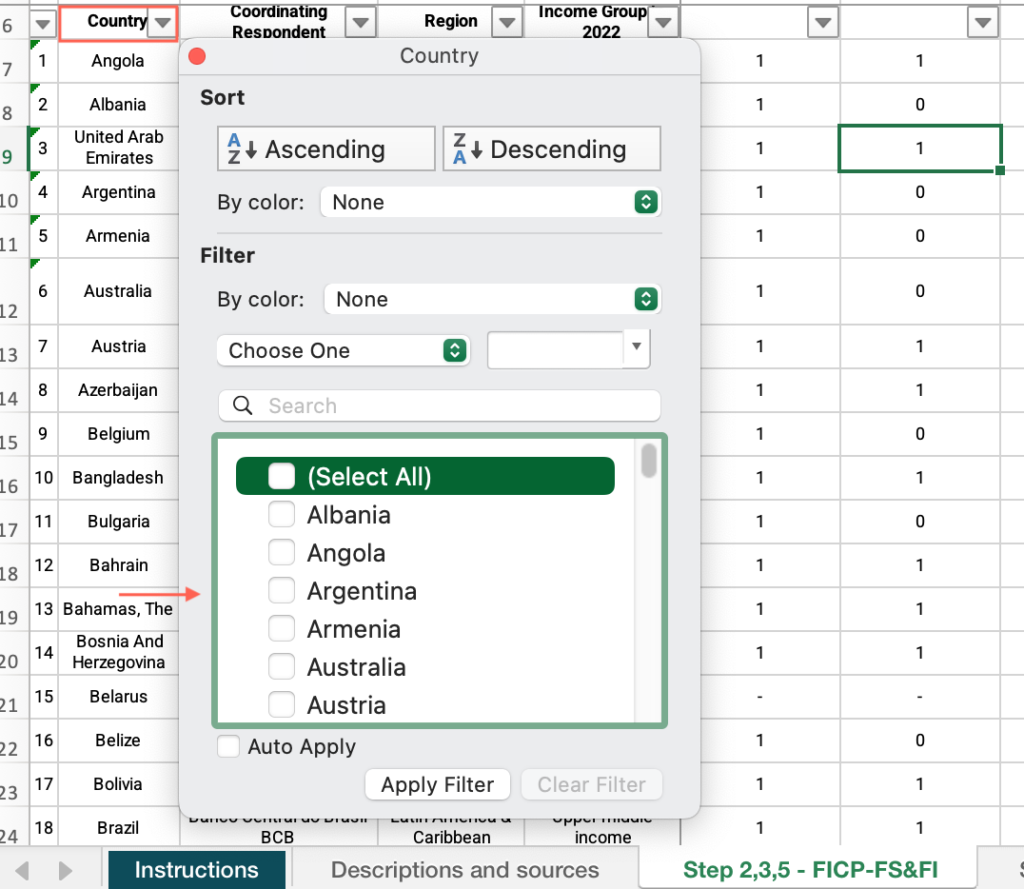
- Under the “What types of financial institutions exist in your country” column, locate the six institutional classifications for your country and answer the question on the platform.
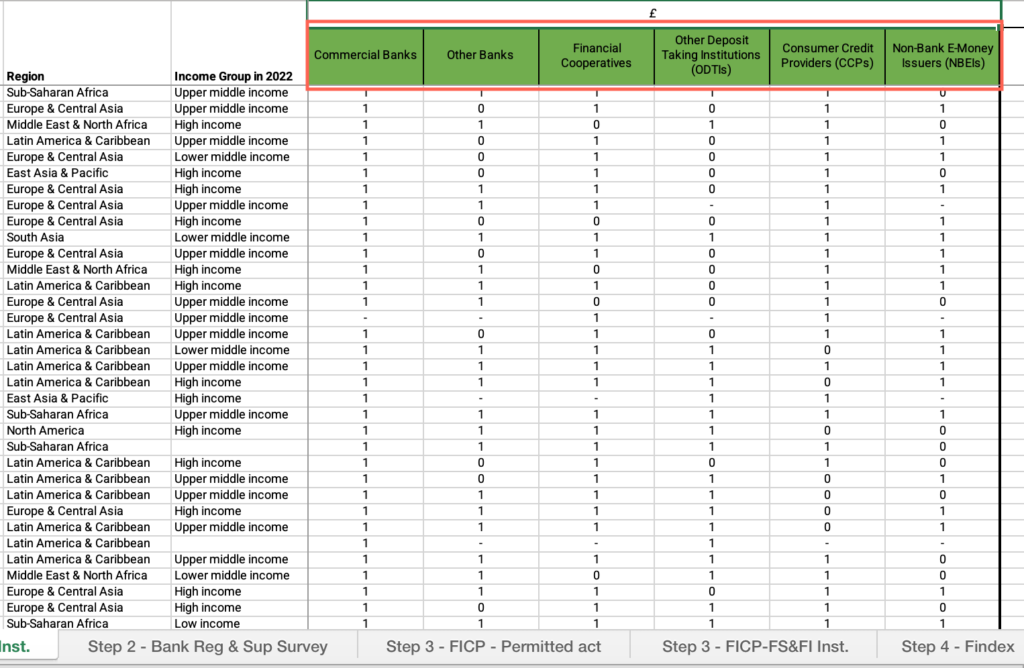
Step 2: Do non-bank institutions need to partner with a bank to issue e-money?
- In the M1 – What is the situation of financial inclusion-databases Excel file, open the “Step 2 – FICP-FS&FI Inst.” sheet.
- Locate the “Country” column > Apply the filter > Uncheck “Select all” > Filter by your country.
- Find “B2.b Can non-bank institutions issue e-money?” and answer the question on the platform.
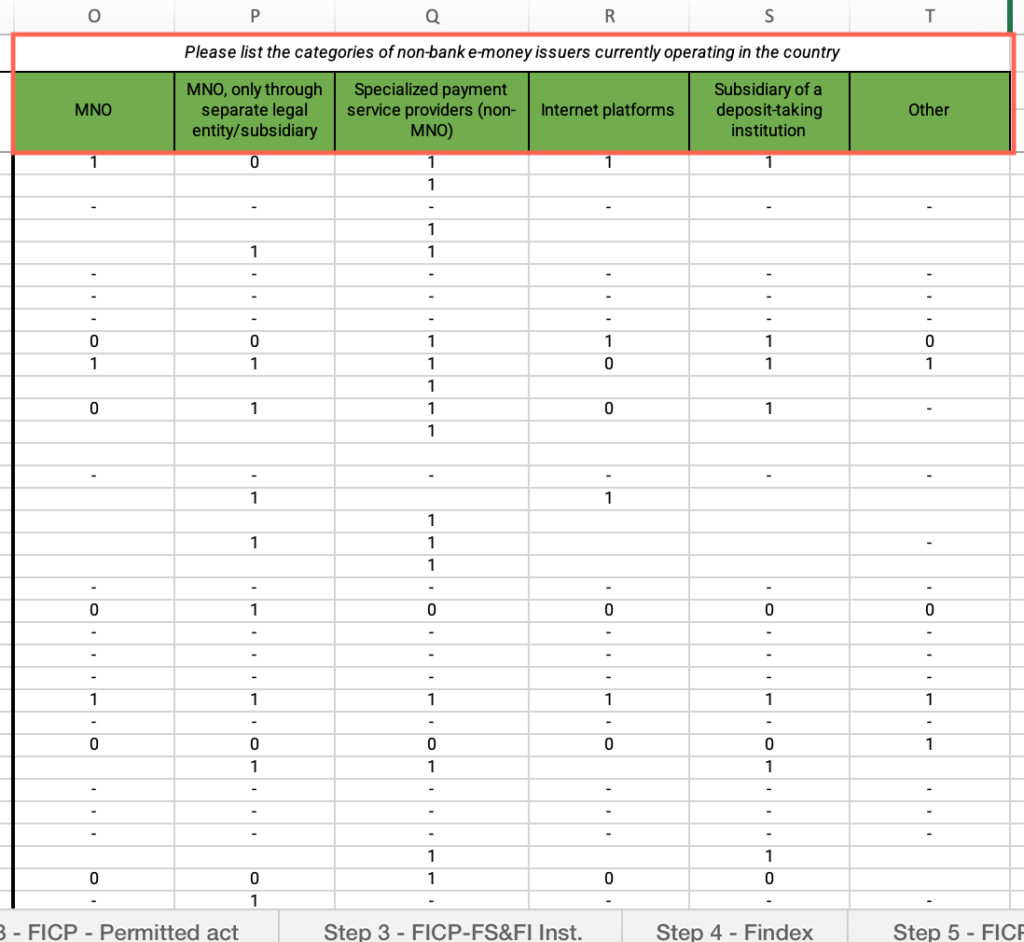
Step 2: Categories of non-bank e-money issuers currently operating in the country
- In the M1 – What is the situation of financial inclusion-databases Excel file, open the “Step 2 – FICP-FS&FI Inst.” sheet.
- Locate the “Country” column > Apply the filter > Uncheck “Select all” > Filter by your country.
- Find the “Nonbank E-Money Issuers (NBEIs)” column > Find “If 1 to B2.b – Please list the categories of non-bank e-money issuers currently operating in the country” and answer the question on the platform.

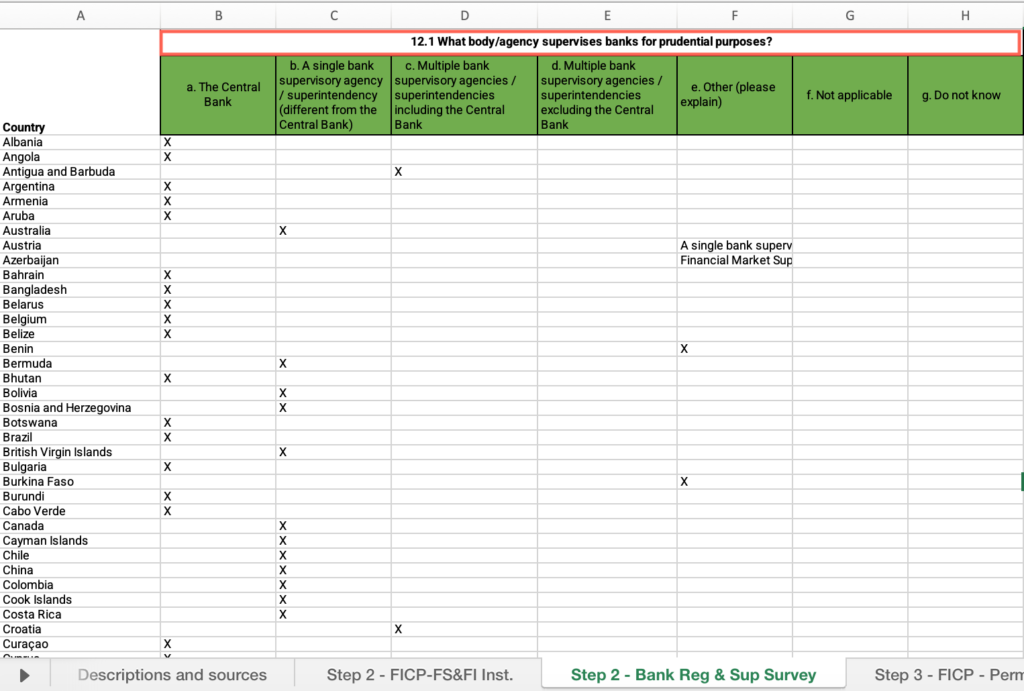
Step 2: What body/agency supervises banks for prudential purposes in your country?
- In the M1 – What is the situation of financial inclusion-databases Excel file, open the “Step 2 – Bank Reg & Sup Survey” sheet.
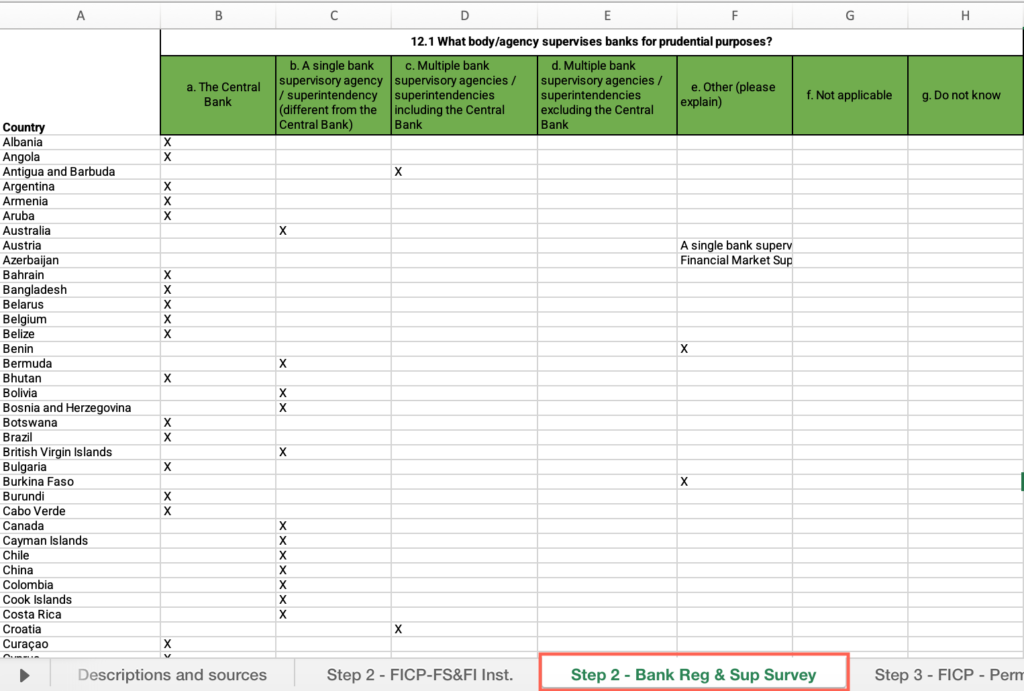
- Find the cells with the check boxes for the corresponding supervising body/agency and answer the question on the platform.
Step 3: Which types of institutions are authorized to:
- In the M1 – What is the situation of financial inclusion-databases Excel file, open the “Step 3 – FICP – Permitted act” sheet.
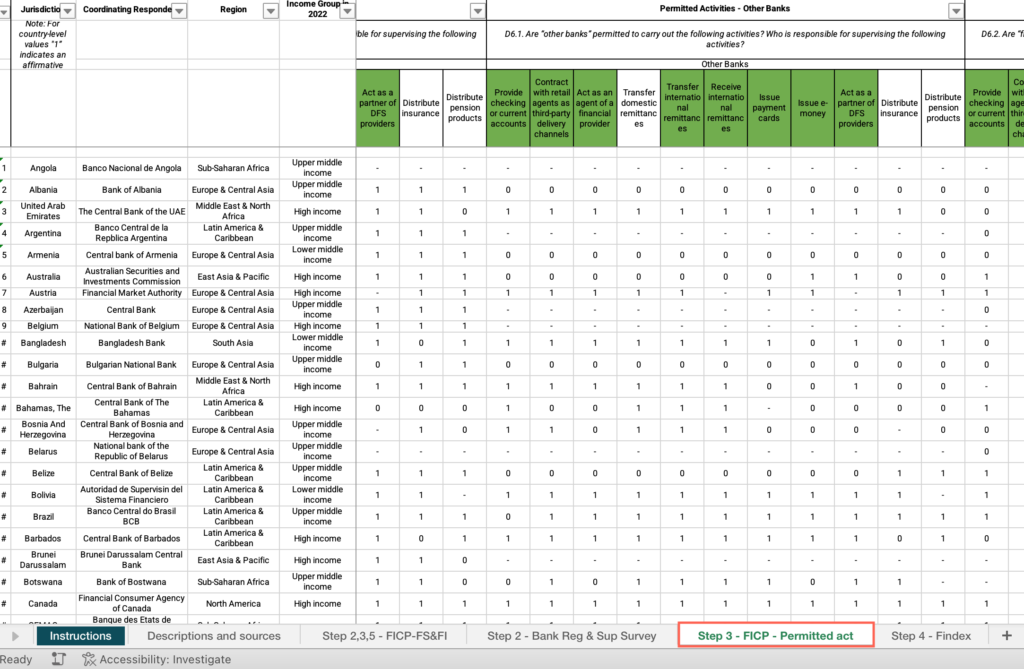
- Locate the “Country” column > Apply the filter > Uncheck “Select all” > Filter by your country.
- Find the respective cell for each institution.

- Under each institution, find the responses for each permitted activity > Answer the question on the platform for each institution.

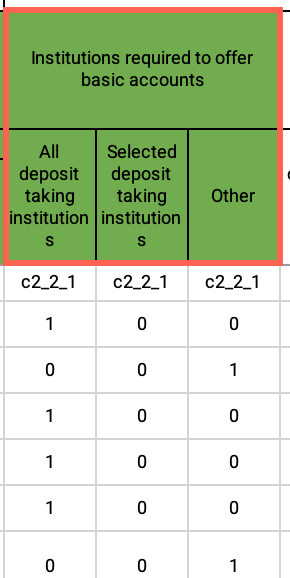
Step 3: Are institutions required to offer basic accounts?
- In the M1 – What is the situation of financial inclusion-databases Excel file, open the “Step 3 – FICP-FS&FI Inst.” sheet.
- Locate the “Country” column > Apply the filter > Uncheck “Select all” > Filter by your country.
- Find “Institutions required to offer basic accounts” and answer the question on the platform.
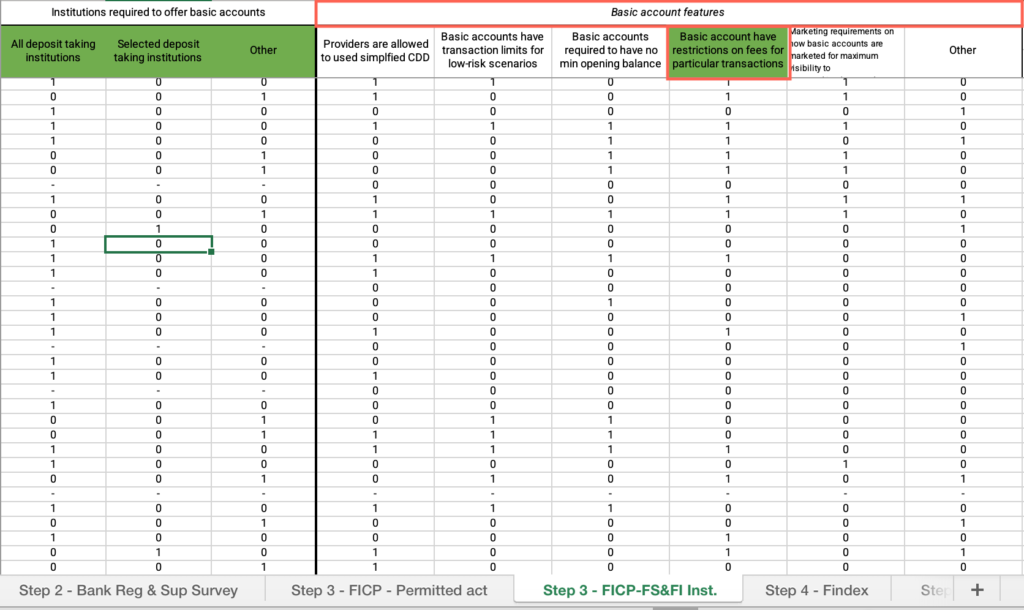
Step 3: Do basic accounts have restrictions on fees for particular transactions?
- In the M1 – What is the situation of financial inclusion-databases Excel file, open the “Step 3 – FICP-FS&FI Inst.” sheet.
- Under “Basic account features” > Find “Basic account have restrictions on fees for particular transactions” and answer the question on the platform.
Step 4: What percentage of adult population owns a financial account?
- In the M1 – What is the situation of financial inclusion-databases Excel file, open the “Step 4 – Findex” sheet.
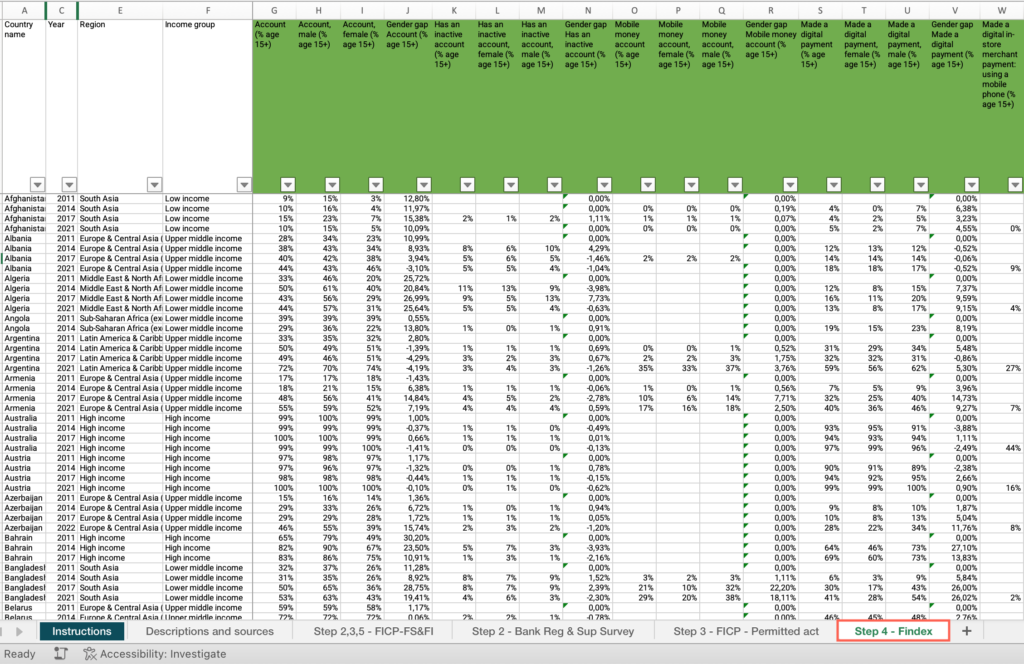
- Locate the “Country ” column > Apply the filter > Uncheck “Select all” > Filter by your country.
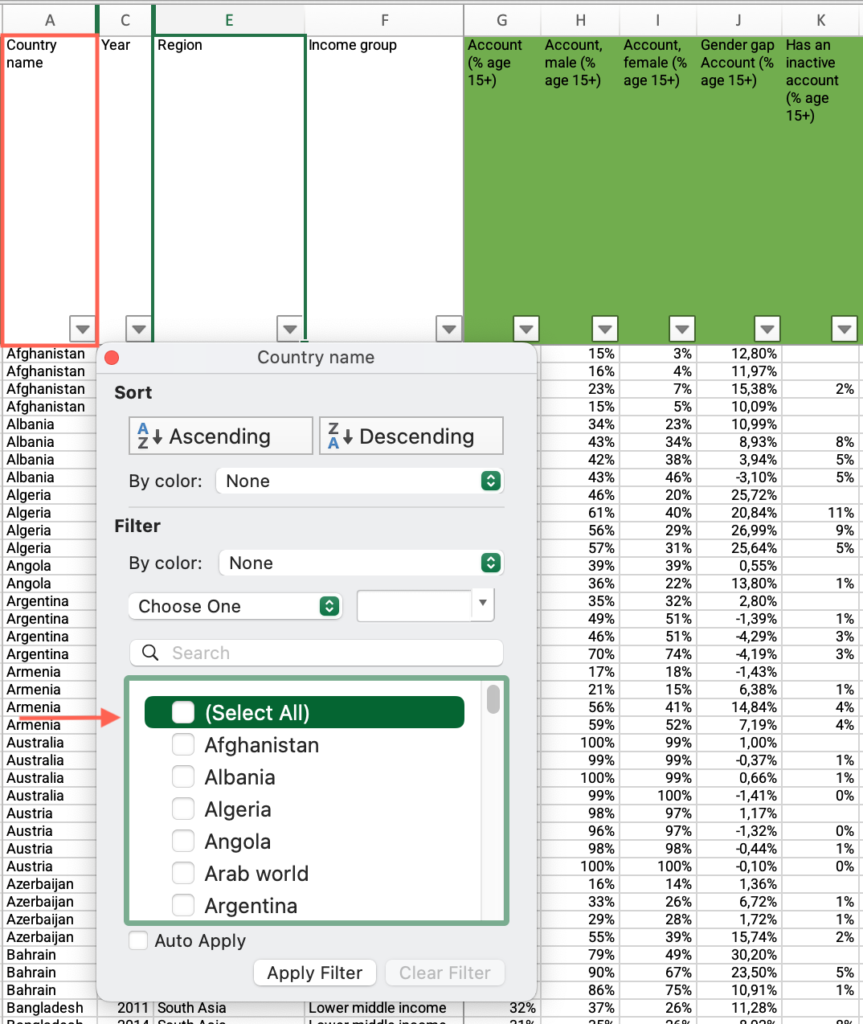
- Locate the “Year” column > Apply the filter > Uncheck “Select all” > Filter by the most recent year.
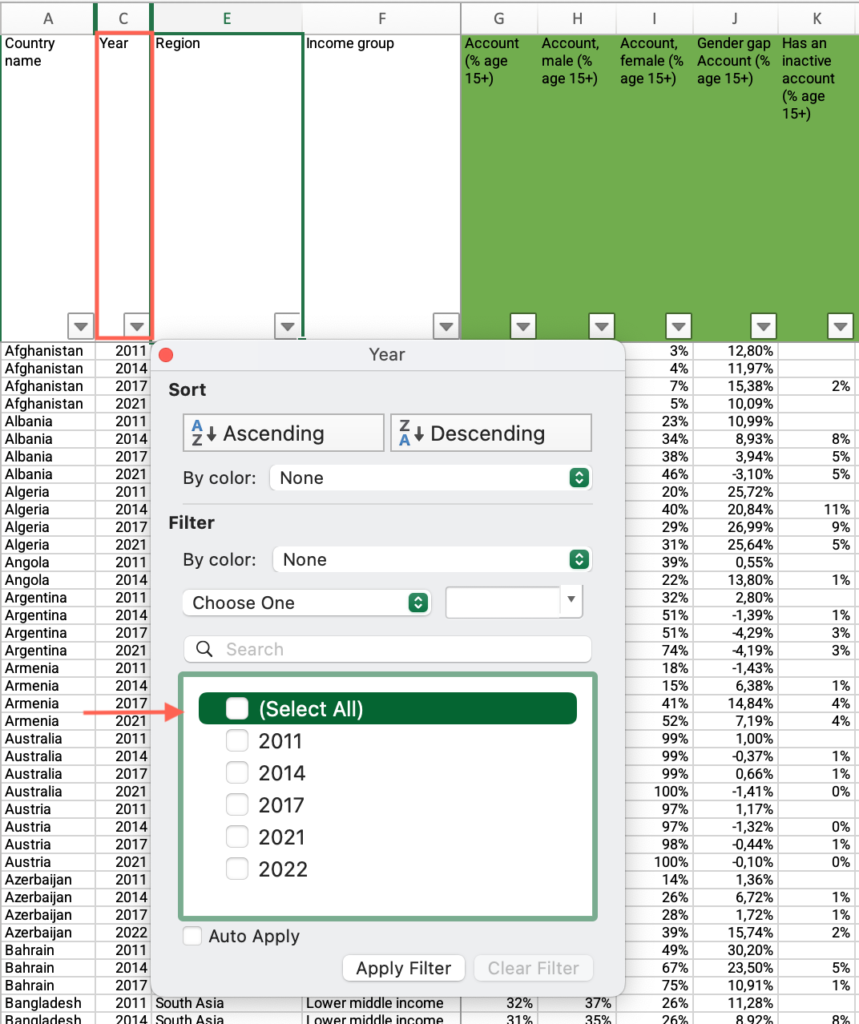
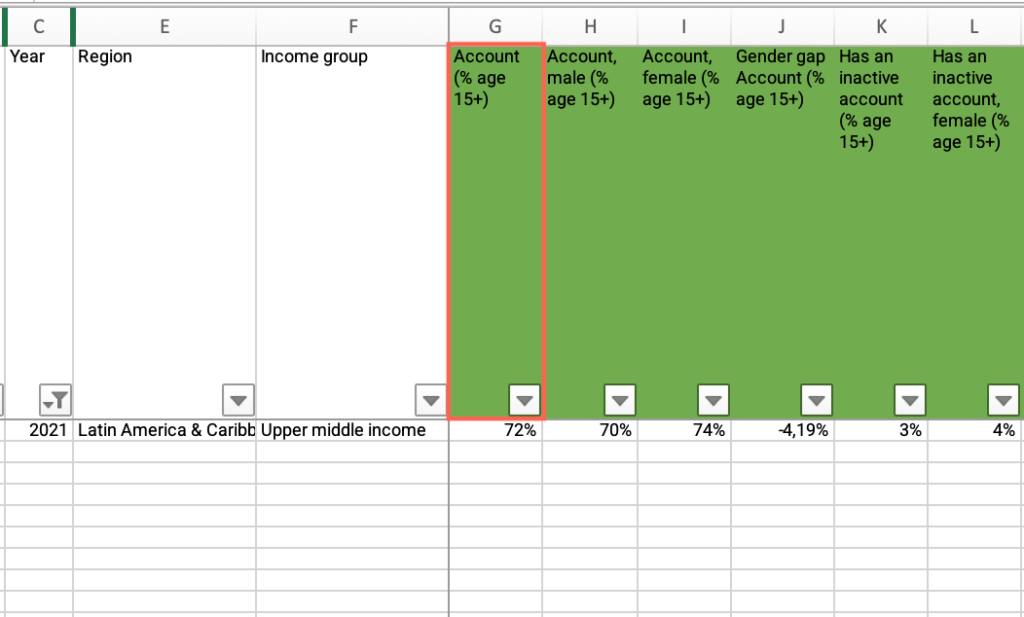
- Locate the “Account (% age 15+)” column > Find the value > Use the slider to answer the question on the platform.
Step 4: Is your country’s account ownership percentage below your income group average?
- In the M1 – What is the situation of financial inclusion-databases Excel file, open the “Step 4 – Findex” sheet.
- If you have applied the filter by your country, locate the “Country ” column > Apply the filter > Check “Select all.”
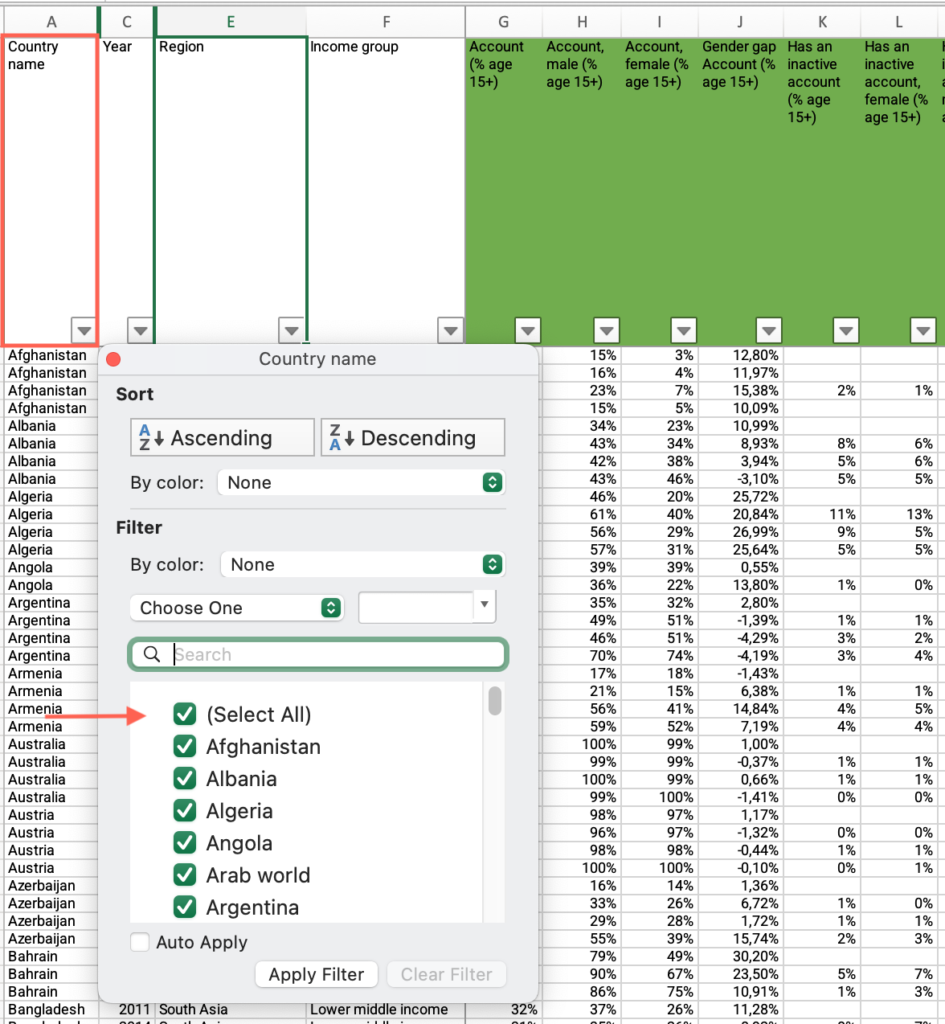
- Locate the “Income Group” column > Apply the filter > Uncheck “Select all” > Filter by your country’s income group.
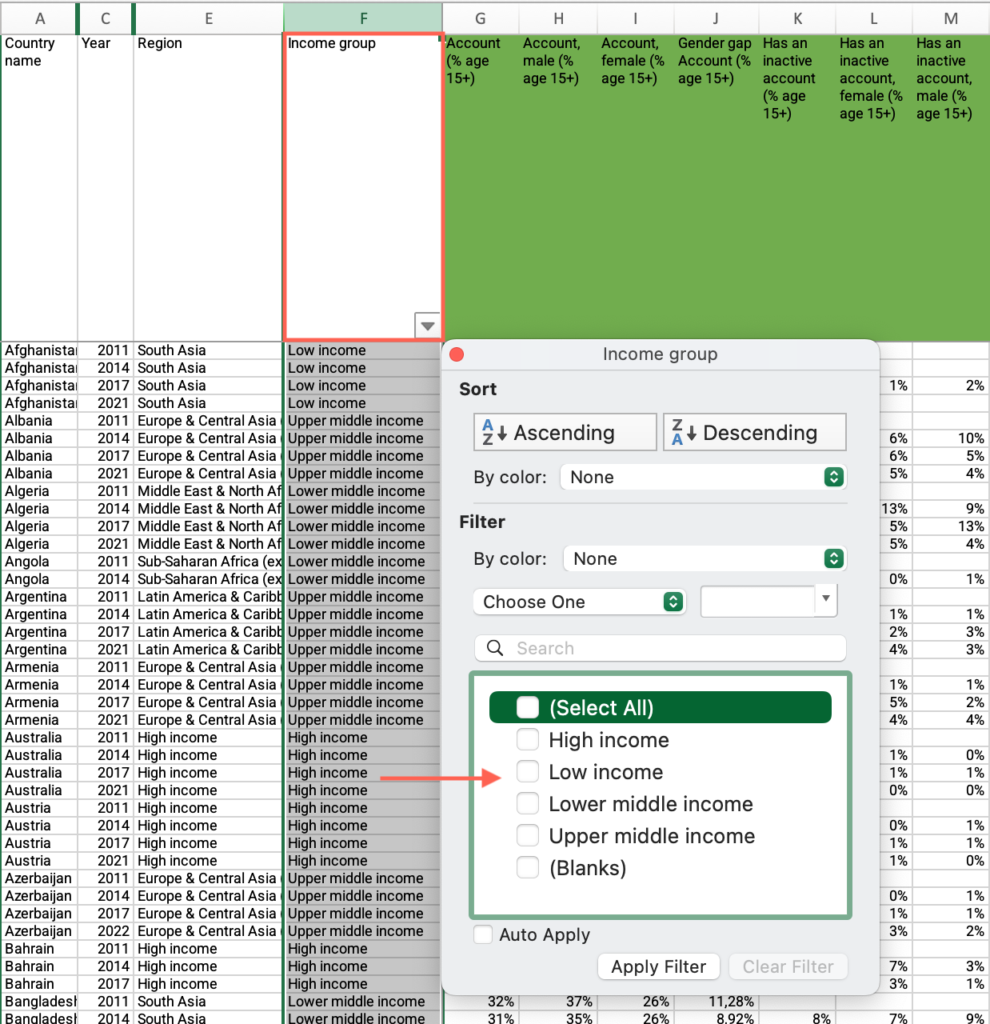
- Locate the “Year” column > Apply the filter > Uncheck “Select all” > Filter by the most recent year.
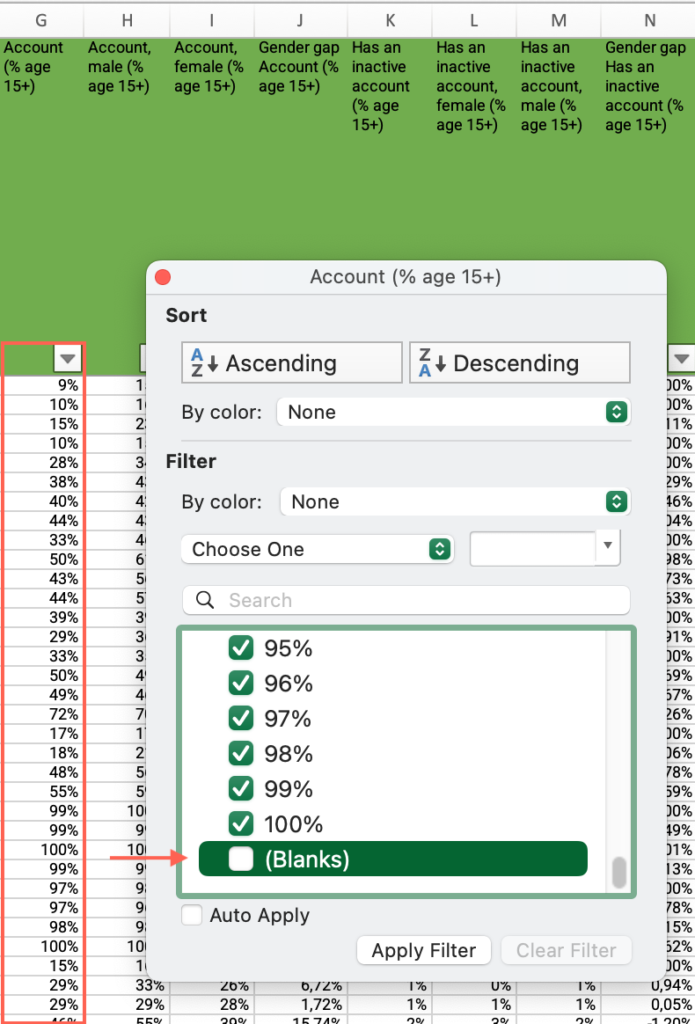
- Locate the “Account (% age 15+)” column > Apply the filter > Uncheck “Blanks.”
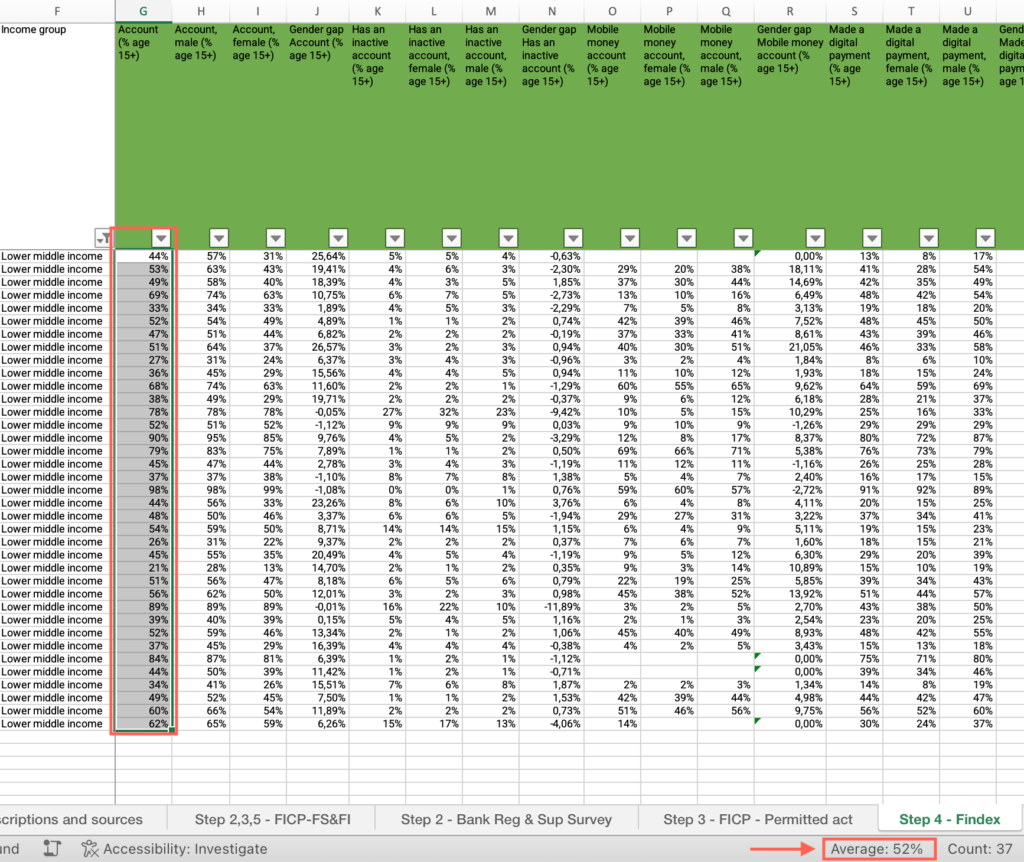
- Click and drag to select the entire range of cells in the “Account (% age 15+)” column > Find the average at the bottom of the sheet and answer the question on the platform.
Step 4: Which statement best describes your country when analyzing changes in account ownership over time?
- In the M1 – What is the situation of financial inclusion-databases Excel file, open the “Step 4 – Findex” sheet.
- Locate the “Country ” column > Apply the filter > Uncheck “Select all” > Filter by your country.
- If you have applied the filter by the most recent year, locate the “Year” column > Apply the filter > Check “Select all.”
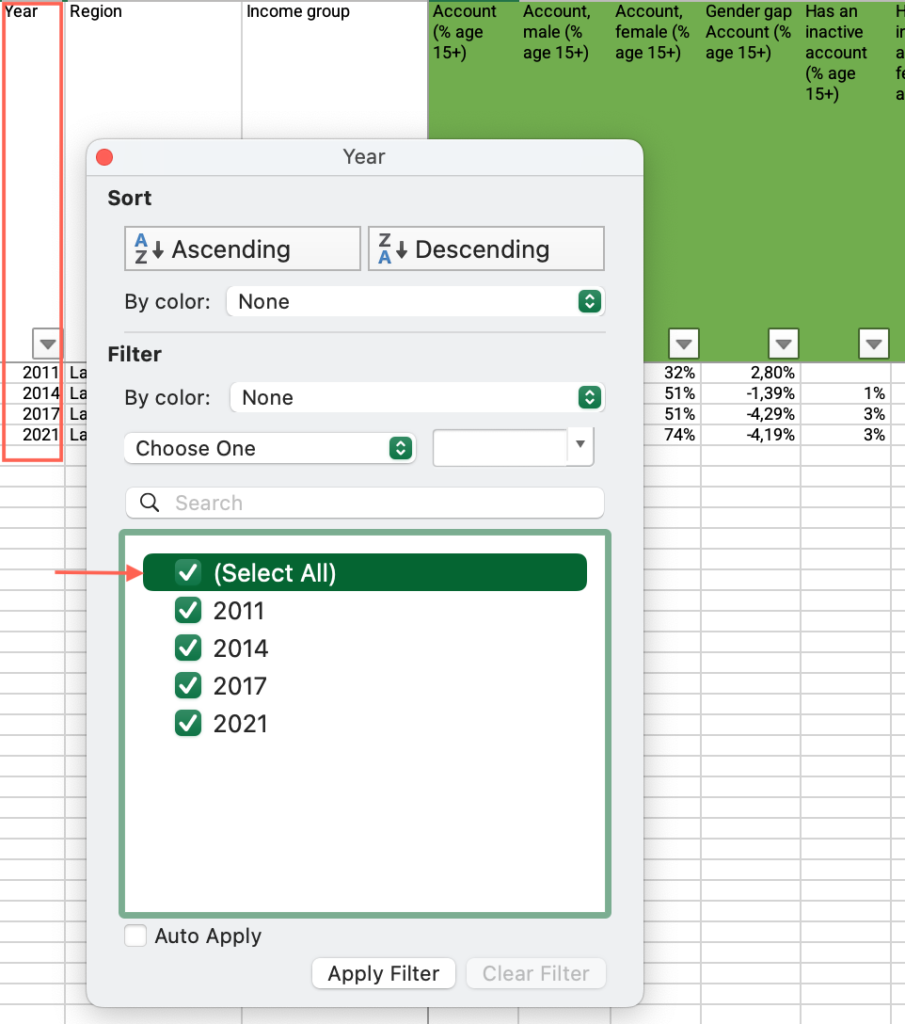
- Locate the “Account (% age 15+)” column > Find and compare the values for all available years > Answer the question on the platform.
Step 4: How would you describe the gender gap in account ownership in your country?
- In the M1 – What is the situation of financial inclusion-databases Excel file, open the “Step 4 – Findex” sheet.
- Locate the “Country ” column > Apply the filter > Uncheck “Select all” > Filter by your country.
- Locate the “Year” column > Apply the filter > Uncheck “Select all” > Filter by the most recent year.
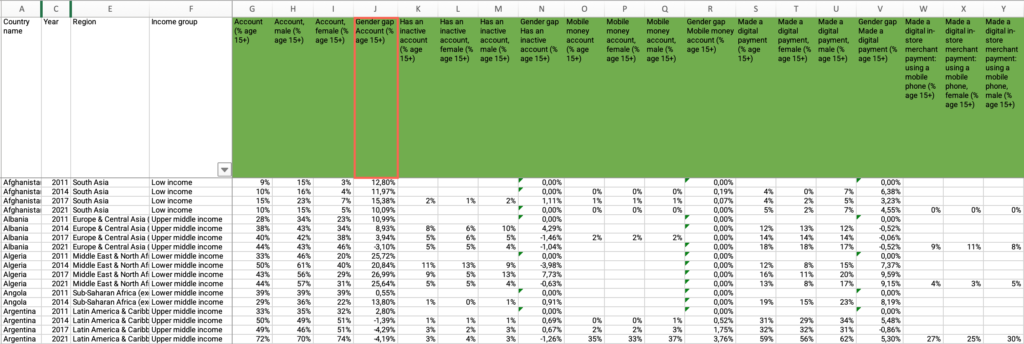
- Locate the “Gender gap Account (% age 15+)” column > Find the value and answer the question on the platform.
Step 4: What percentage of account holders has an inactive account?
- In the M1 – What is the situation of financial inclusion-databases Excel file, open the “Step 4 – Findex” sheet.
- Locate the “Country” column > Apply the filter > Uncheck “Select all” > Filter by your country.
- Locate the “Year” column > Apply the filter > Uncheck “Select all” > Filter by the most recent year.
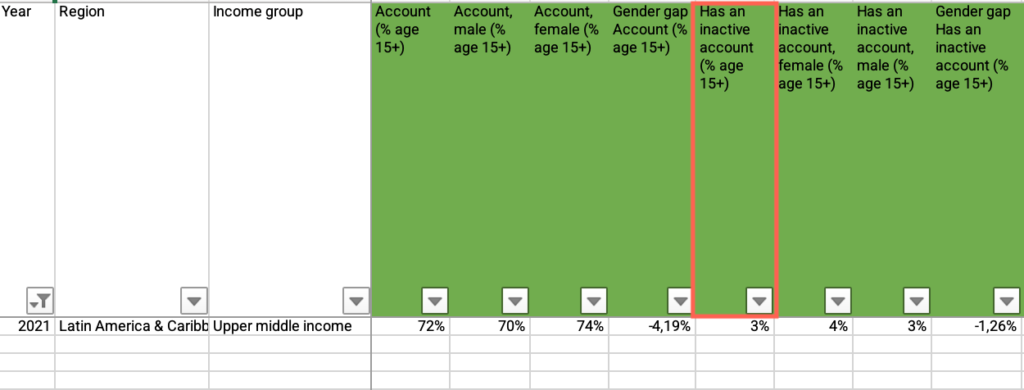
- Locate the “Has an inactive account (% age 15+)” column > Find the value > Use the slider to answer the question on the platform.
Step 4: Is account inactivity in your country above your income group average?
- In the M1 – What is the situation of financial inclusion-databases Excel file, open the “Step 4 – Findex” sheet.
- If you have applied the filter by your country, locate the “Country” column > Apply the filter > Check “Select all.”
- Locate the “Income Group” column > Apply the filter > Uncheck “Select all” > Filter by your country’s income group.
- Locate the “Year” column > Apply the filter > Uncheck “Select all” > Filter by the most recent year.
- Locate the “Has an inactive account (% age 15+)” column > Apply the filter > Uncheck “Blanks.”
- Click and drag to select the entire range of cells in the “Has an inactive account (% age 15+)” column > Find the average at the bottom of the sheet and answer the question on the platform.
Step 4: Which statement best describes your country when analyzing changes in account inactivity over time?
- In the M1 – What is the situation of financial inclusion-databases Excel file, open the “Step 4 – Findex” sheet.
- Locate the “Country” column > Apply the filter > Uncheck “Select all” > Filter by your country.
- If you have applied the filter by the most recent year, locate the “Year” column > Apply the filter > Check “Select all.”
- Locate the “Has an inactive account (% age 15+)” column > Find and compare the values for all available years > Answer the question on the platform.
Step 4: What percentage of the adult population uses mobile money account?
- In the M1 – What is the situation of financial inclusion-databases Excel file, open the “Step 4- Findex” sheet.
- Locate the “Country” column > Apply the filter > Uncheck “Select all” > Filter by your country.
- Locate the “Year” column > Apply the filter > Uncheck “Select all” > Filter by the most recent year.
- Find “Mobile money account (% age 15+)” > Find the value > Use the slider to answer the question on the platform.

Step 4: Is your country’s mobile money account ownership below your income group average?
- In the M1 – What is the situation of financial inclusion-databases Excel file, open the “Step 4- Findex” sheet.
- If you have applied the filter by your country, locate the “Country” column > Apply the filter > Check “Select all.”
- Locate the “Income Group” column > Apply the filter > Uncheck “Select all” > Filter by your country’s income group.
- Locate the “Year” column > Apply the filter > Uncheck “Select all” > Filter by the most recent year.
- Locate the “Mobile money account (% age 15+)” column > Apply the filter > Uncheck “Blanks.”
- Select the entire range of cells in the “Mobile money account (% age 15+)” column > Find the average at the bottom of the sheet and answer the question on the platform.
Step 4: Which statement best describes your country when analyzing changes in mobile money account ownership over time?
- In the M1 – What is the situation of financial inclusion-databases Excel file, open the “Step 4 – Findex” sheet.
- Locate the “Country” column > Apply the filter > Uncheck “Select all” > Filter by your country.
- If you have applied the filter by the most recent year, locate the “Year” column > Apply the filter > Check “Select all.”
- Locate the “Mobile money account (% age 15+)” column > Find and compare the values for all available years > Answer the question on the platform.
Step 4: What is the gap between men and women in the indicator Mobile money account (% age 15+)?
- In the M1 – What is the situation of financial inclusion-databases Excel file, open the “Step 4 – Findex” sheet.
- Locate the “Country” column > Apply the filter > Uncheck “Select all” > Filter by your country.
- Locate the “Year” column > Apply the filter > Uncheck “Select all” > Filter by the most recent year.
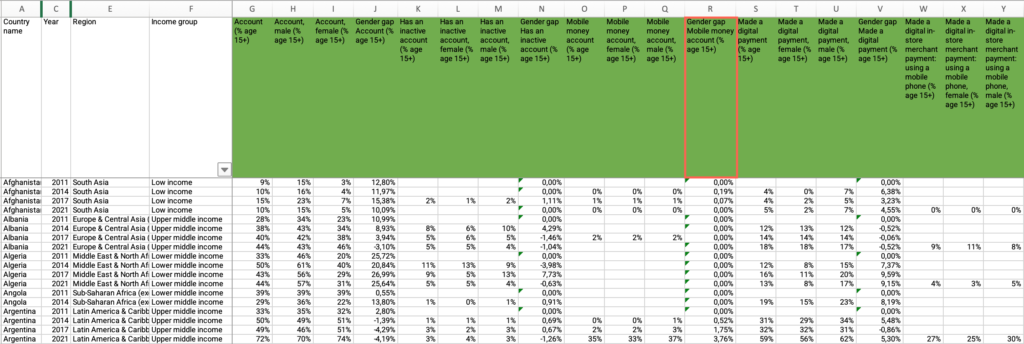
- Locate the “Gender gap Mobile money account (% age 15+)” column > Find the value and answer the question on the platform.
Step 4: Is the gap in mobile money account ownership higher than in countries in your same income group?
- In the M1 – What is the situation of financial inclusion-databases Excel file, open the “Step 4 – Findex” sheet.
- If you have applied the filter by your country, locate the “Country” column > Apply the filter > Check “Select all.”
- Locate the “Income Group” column > Apply the filter > Uncheck “Select all” > Filter by your country’s income group.
- Locate the “Year” column > Apply the filter > Uncheck “Select all” > Filter by the most recent year.
- Locate the “Gender gap Mobile money account (% age 15+)” column > Apply the filter > Uncheck “Blanks.”
- Select the entire range of cells under the “Gender gap Mobile money account (% age 15+)” column > Find the average at the bottom of the sheet and answer the question on the platform.
Step 4: What percentage of the adult population made a digital payment in the last year?
- In the M1 – What is the situation of financial inclusion-databases Excel file, open the “Step 4 – Findex” sheet.
- Locate the “Country” column > Apply the filter > Uncheck “Select all” > Filter by your country.
- Locate the “Year” column > Apply the filter > Uncheck “Select all” > Filter by the most recent year.
- Find “Made a digital payment (% age 15+)” > Find the value > Use the slider to answer the question on the platform.

Step 4: Is your country below your income group average in the indicator “Made a digital payment (% age 15+)?
- In the M1 – What is the situation of financial inclusion-databases Excel file, open the “Step 4 – Findex” sheet.
- If you have applied the filter by your country, locate the “Country” column > Apply the filter > Check “Select all.”
- Locate the “Income Group” column > Apply the filter > Uncheck “Select all” > Filter by your country’s income group.
- Locate the “Year” column > Apply the filter > Uncheck “Select all” > Filter by the most recent year.
- Locate the “Made a digital payment (% age 15+)” column > Apply the filter > Uncheck “Blanks.”
- Select the entire range of cells under the “Made a digital payment (% age 15+)” column > Find the average at the bottom of the sheet and answer the question on the platform.
Step 4: Which statement best describes your country when analyzing changes in the indicator “Made a digital payment (% age 15+) over time?
- In the M1 – What is the situation of financial inclusion-databases Excel file, open the “Step 4 – Findex” sheet.
- Locate the “Country” column > Apply the filter > Uncheck “Select all” > Filter by your country.
- If you have applied the filter by the most recent year, locate the “Year” column > Apply the filter > Check “Select all.”
- Locate the “Made a digital payment (% age 15+)” column > Find and compare the values for all available years > Answer the question on the platform.
Step 4: What is the gap between men and women in the indicator Made a digital payment (% age 15+)?
- In the M1 – What is the situation of financial inclusion-databases Excel file, open the “Step 4 – Findex” sheet.
- Locate the “Country” column > Apply the filter > Uncheck “Select all” > Filter by your country.
- Locate the “Year” column > Apply the filter > Uncheck “Select all” > Filter by the most recent year.
- Locate the “Gender gap Made a digital payment (% age 15+)” column > Find the value > Use the slider to answer the question on the platform.
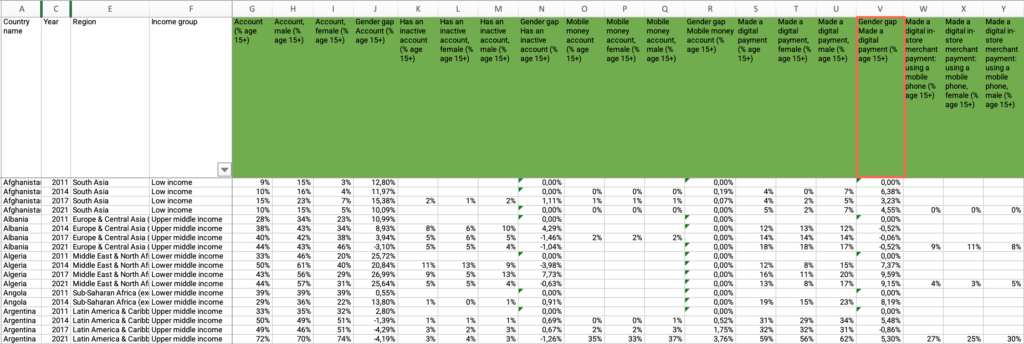
Step 4: Is the gap between men and women in the indicator Made a digital payment (% age 15+) greater than the world average?
- In the M1 – What is the situation of financial inclusion-databases Excel file, open the “Step 4 – Findex” sheet.
- If you have applied the filter by your country, locate the “Country” column > Apply the filter > Check “Select all.”
- Locate the “Year” column > Apply the filter > Uncheck “Select all” > Filter by the most recent year.
- Locate the “Gender gap Made a digital payment (% age 15+)” column > Apply the filter > Uncheck “Blanks.”
- Select the entire range of cells in under the “Gender gap Made a digital payment (% age 15+)” column > Find the average at the bottom of the sheet and answer the question on the platform.
Step 4: Is the gap between men and women in the indicator Made a digital payment (% age 15+) higher than in countries within your same income group?
- In the M1 – What is the situation of financial inclusion-databases Excel file, open the “Step 4 – Findex” sheet.
- If you have applied the filter by your country, locate the “Country” column > Apply the filter > Check “Select all.”
- Locate the “Income Group” column > Apply the filter > Uncheck “Select all” > Filter by your country’s income group.
- Locate the “Year” column > Apply the filter > Uncheck “Select all” > Filter by the most recent year.
- Locate the “Gender gap Made a digital payment (% age 15+)” column > Apply the filter > Uncheck “Blanks.”
- Select the entire range of cells under the “Gender gap Made a digital payment (% age 15+)” column > Find the average at the bottom of the sheet and answer the question on the platform.
Step 4: Optional Exploration
- Collect the data for the optional indicators repeating the steps from the previous sections.

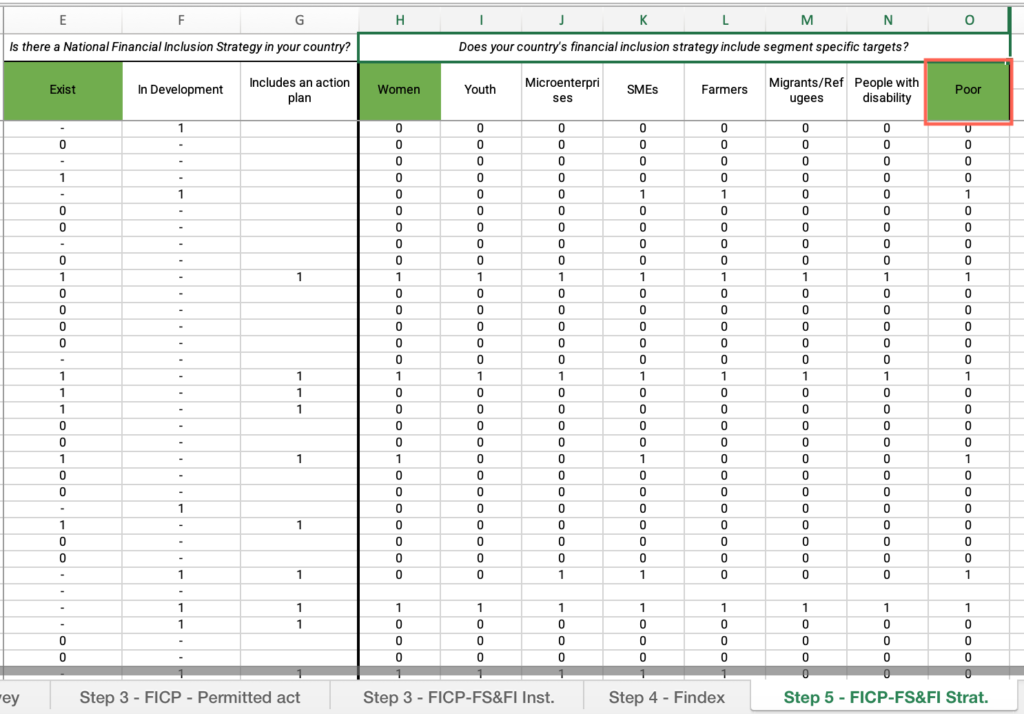
Step 5: Is there a National Financial Inclusion Strategy in your country?
- In the M1 – What is the situation of financial inclusion-databases Excel file, open the “Step 5 – FICP-FS&FI Strat.” sheet.
- Locate the “Country” column > Apply the filter > Uncheck “Select all” > Filter by your country.
- Under “Is there a National Financial Inclusion Strategy in your country?” locate “Exist” > Find your country’s corresponding score and answer the question on the platform.
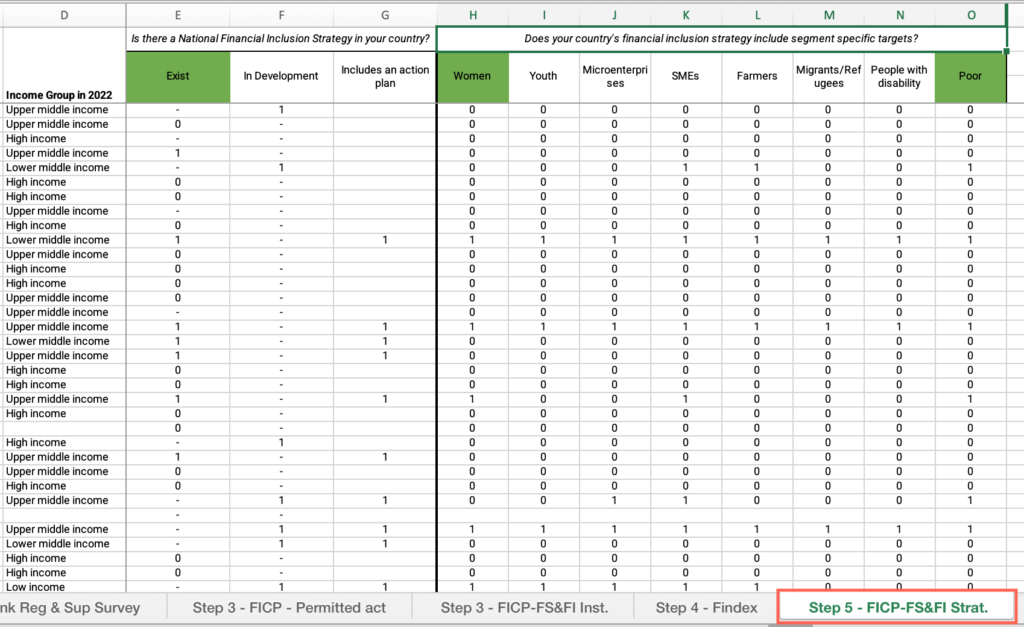
Step 5: Does your country’s strategy include segment specific targets?
- In the M1 – What is the situation of financial inclusion-databases Excel file, open the “Step 5 – FICP-FS&FI Strat.” sheet.
- Locate the “Country” column > Apply the filter > Uncheck “Select all” > Filter by your country.
- Locate “Does your country’s financial inclusion strategy include segment specific targets?”
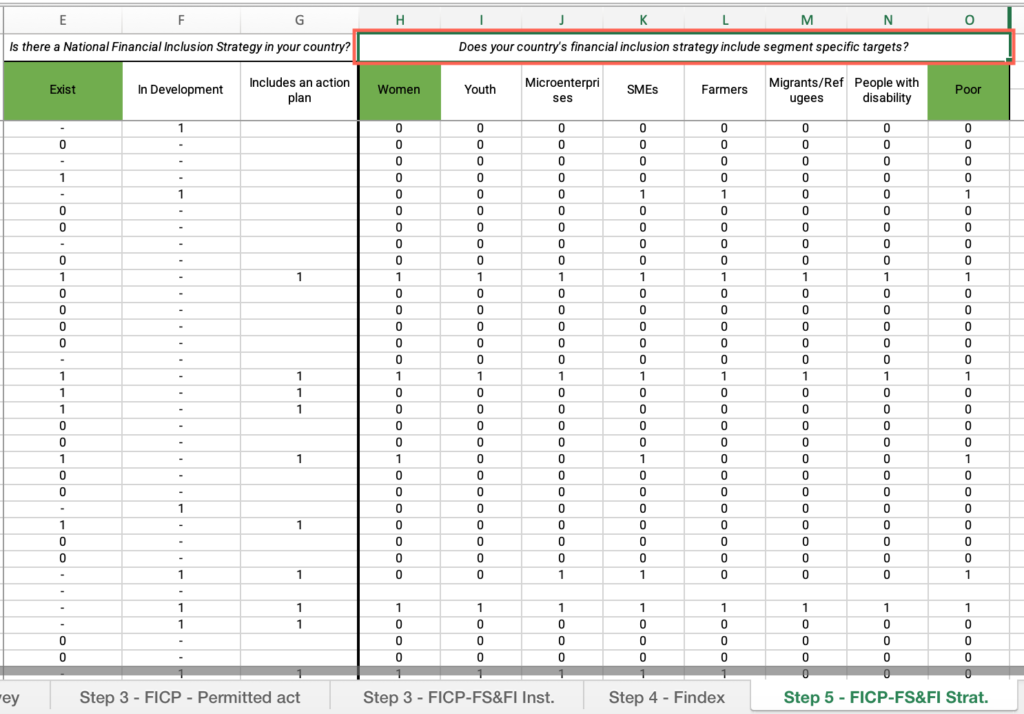
Step 5: Are there differentiated strategies for women?
- In the M1 – What is the situation of financial inclusion-databases Excel file, open the “Step 5 – FICP-FS&FI Strat.” sheet.
- Locate the “Country” column > Apply the filter > Uncheck “Select all” > Filter by your country.
- Under “Does your country’s financial inclusion strategy include segment specific targets?”, locate “Women” > Find your country’s corresponding score and answer the question on the platform.
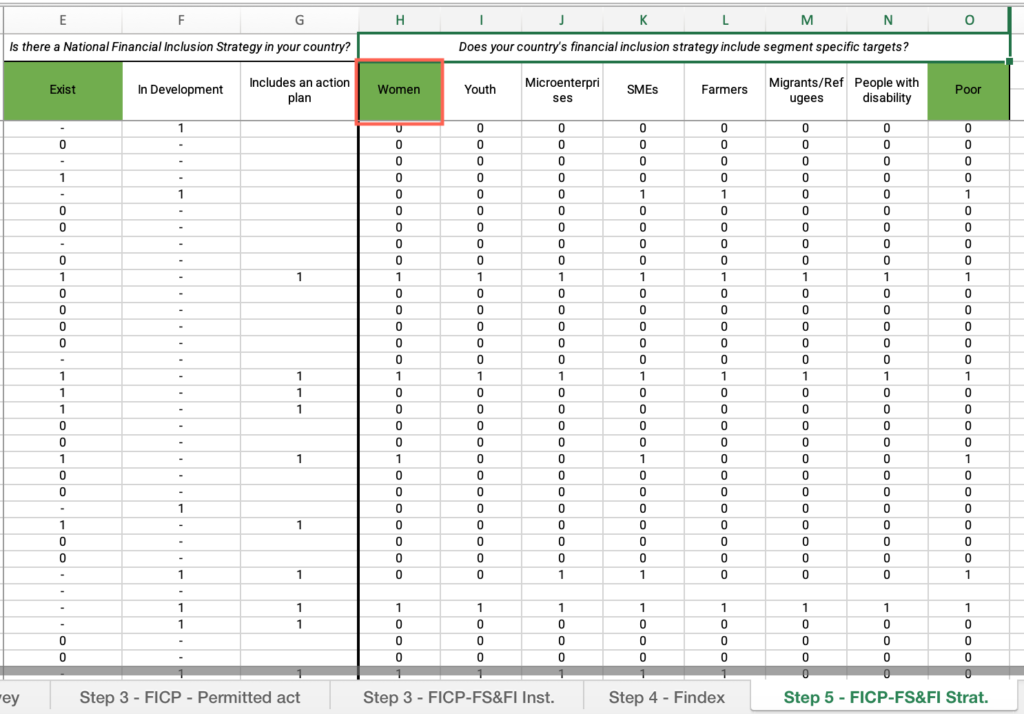
Step 5: Are there differentiated strategies for low-income people?
- In the M1 – What is the situation of financial inclusion-databases Excel file, open the “Step 5 – FICP-FS&FI Strat.” sheet.
- Locate the “Country” column > Apply the filter > Uncheck “Select all” > Filter by your country.
- Under “Does your country’s financial inclusion strategy include segment specific targets?”, locate “Poor” > Find your country’s corresponding score and answer the question on the platform.
