Module 3 Assignment – Excel Tutorials
The following tutorial is an optional resource meant to assist you in navigating the databases and collecting the necessary data for your analysis.
Note on recording your responses: In the assignment you will find all the necessary fields to record your answers and the data you collect. You will also find an optional Answer Sheet Excel file to keep record of the collected data and your findings. You will find this file in the assignment’s introduction.
Step 1: Does your country score less than the world average in the Extent of Market Dominance indicator?
- In the M3 – Step-by-step guide to analyze limited competition – databases Excel file, open the “Step 1 – WEF – Market dominance” sheet.
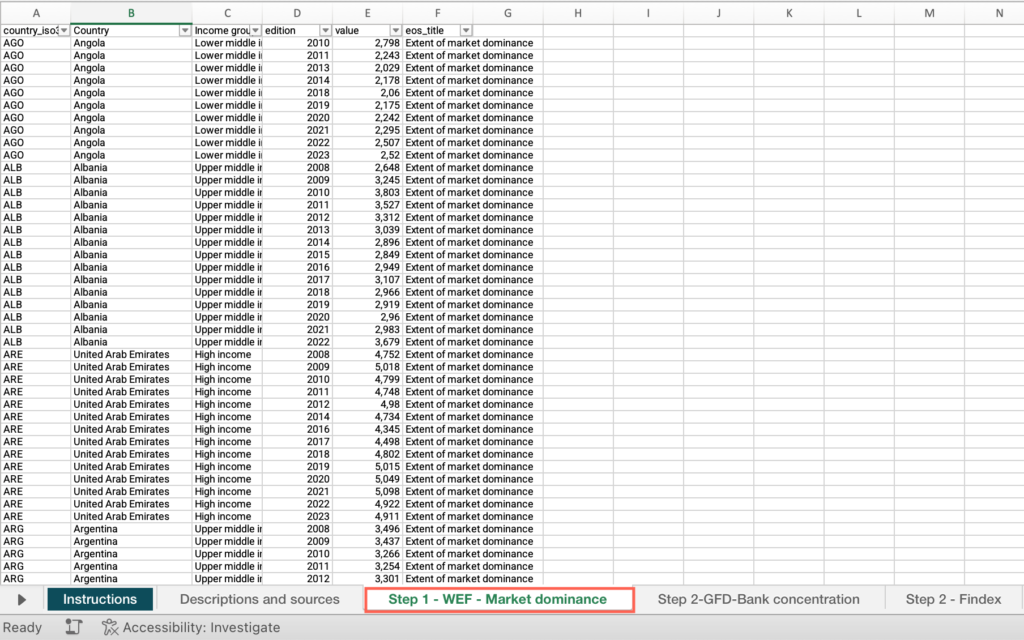
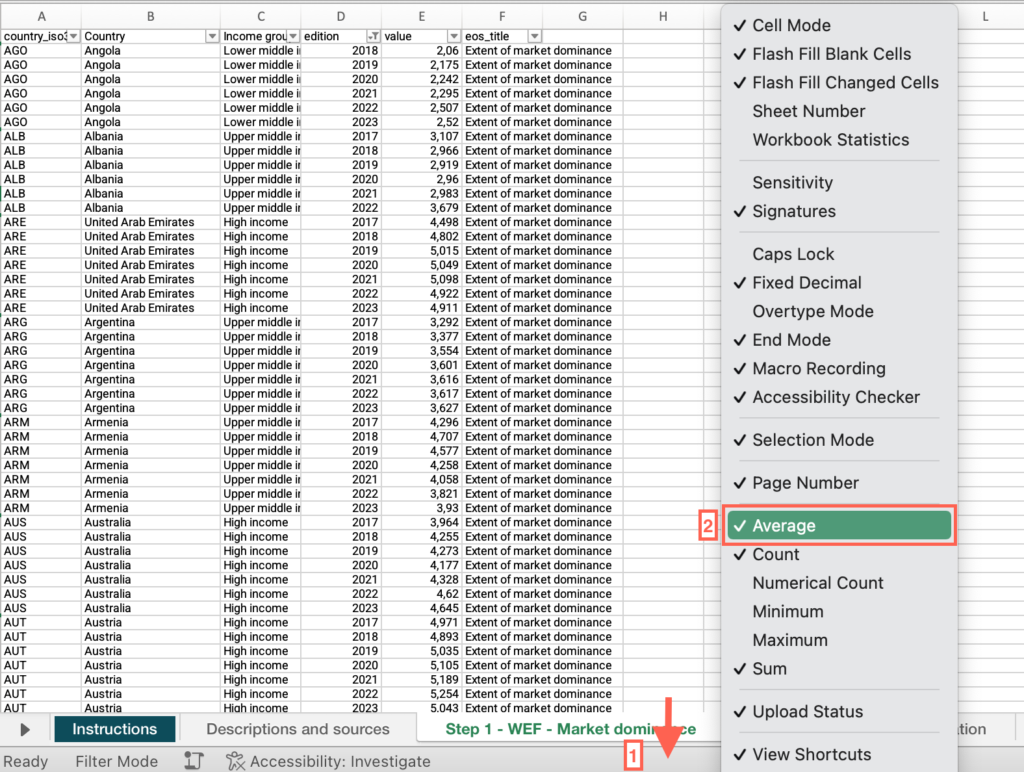
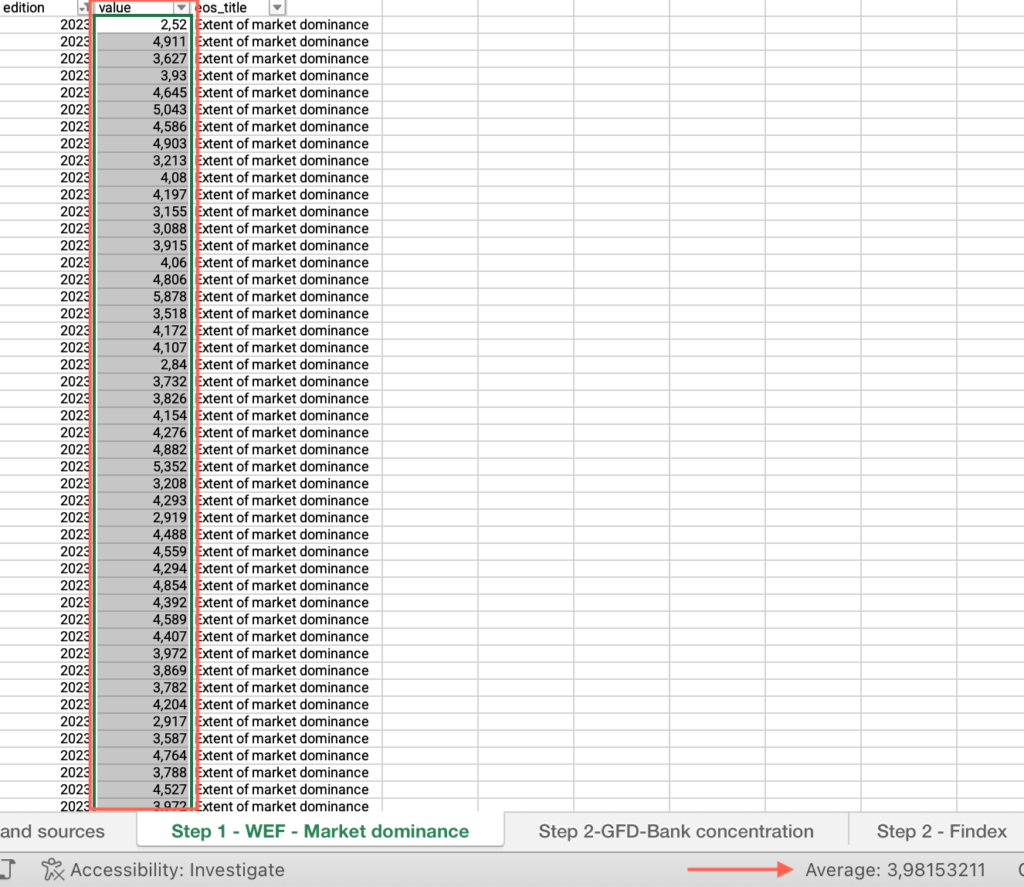
- Right-click on the status bar at the bottom of the Excel window. In the dialog box that appears, ensure that the checkbox for “Average” is checked.
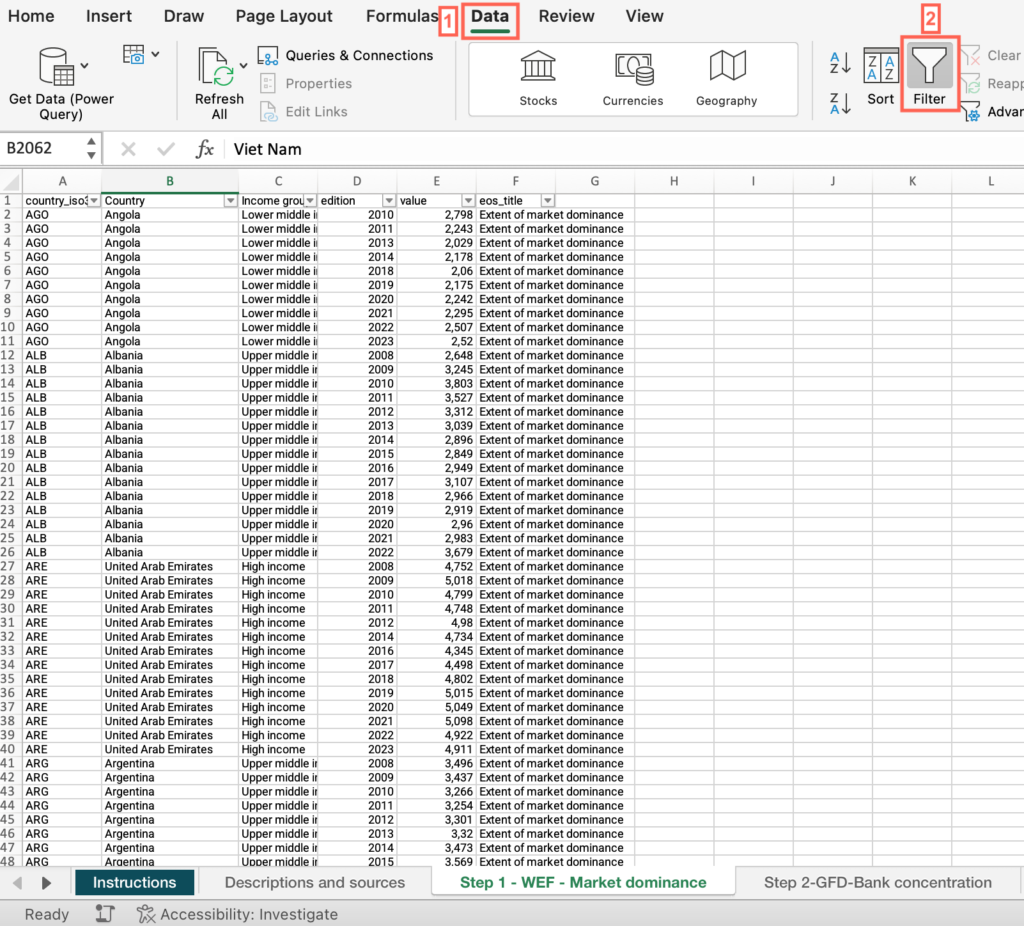
- Select the header row > click the Data menu > Select “Filter”.
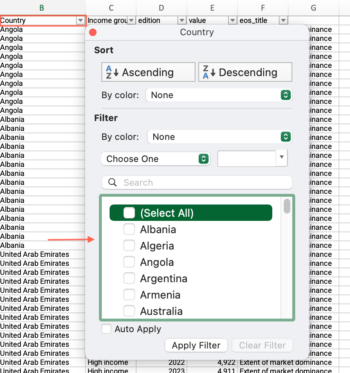
- Now that “Filter” is enabled, click on the dropdown arrow in the “Country” column header > Uncheck “Select All” > Check the box for your country.
- Locate the “value” column > Find the value.
- Click and drag to select the entire range of cells in the value” column > Find the average at the bottom of the sheet, compare it with your country’s score and answer the question on the platform.
Step 1: Is your country’s score in the Extent of Market Dominance indicator significantly below the world average?
- In the M3 – Step-by-step guide to analyze limited competition – databases Excel file, open the “Step 1 – WEF – Market dominance” sheet.
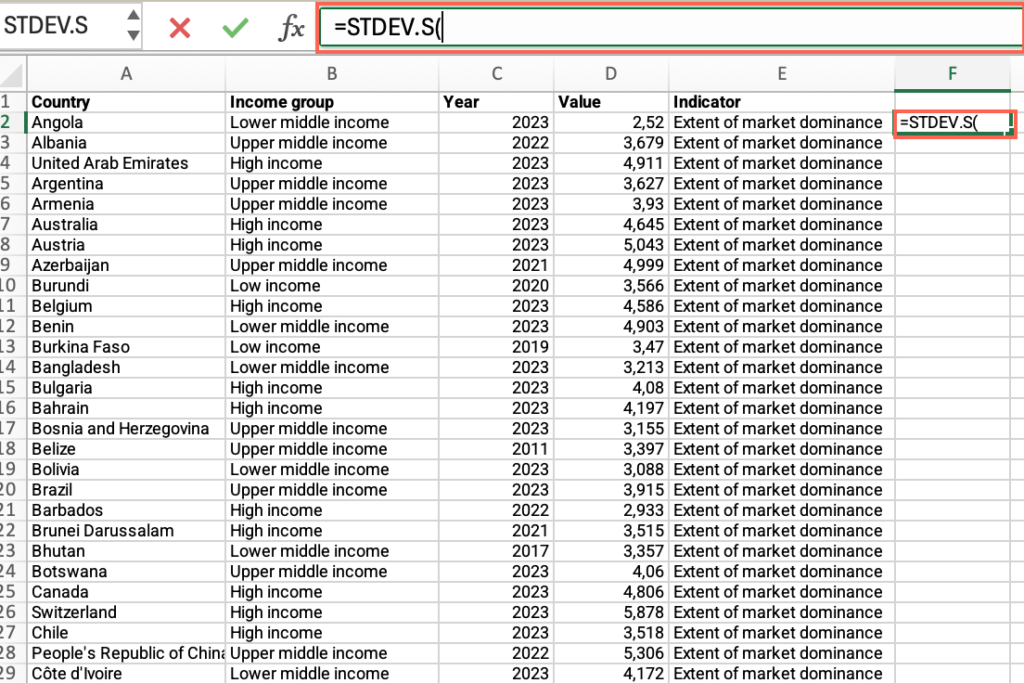
- Select an empty cell next to the “Indicator” column > Type the formula =STDEV.S( [Note that the formula you are typing is shown in the formula bar at the top of the sheet.]
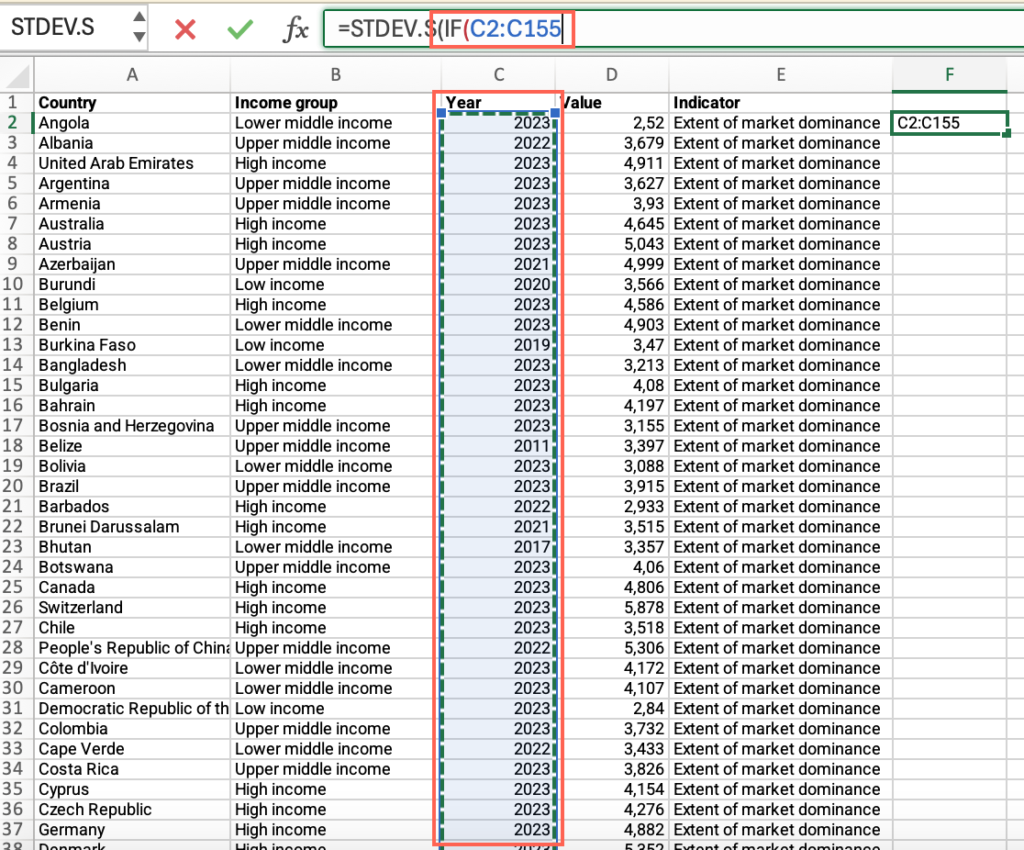
- Click the formula bar and continue typing the formula > Type IF( > Click and drag to select the entire range of cells in the “Year” column. You will see that the range of cells has been added to the formula.
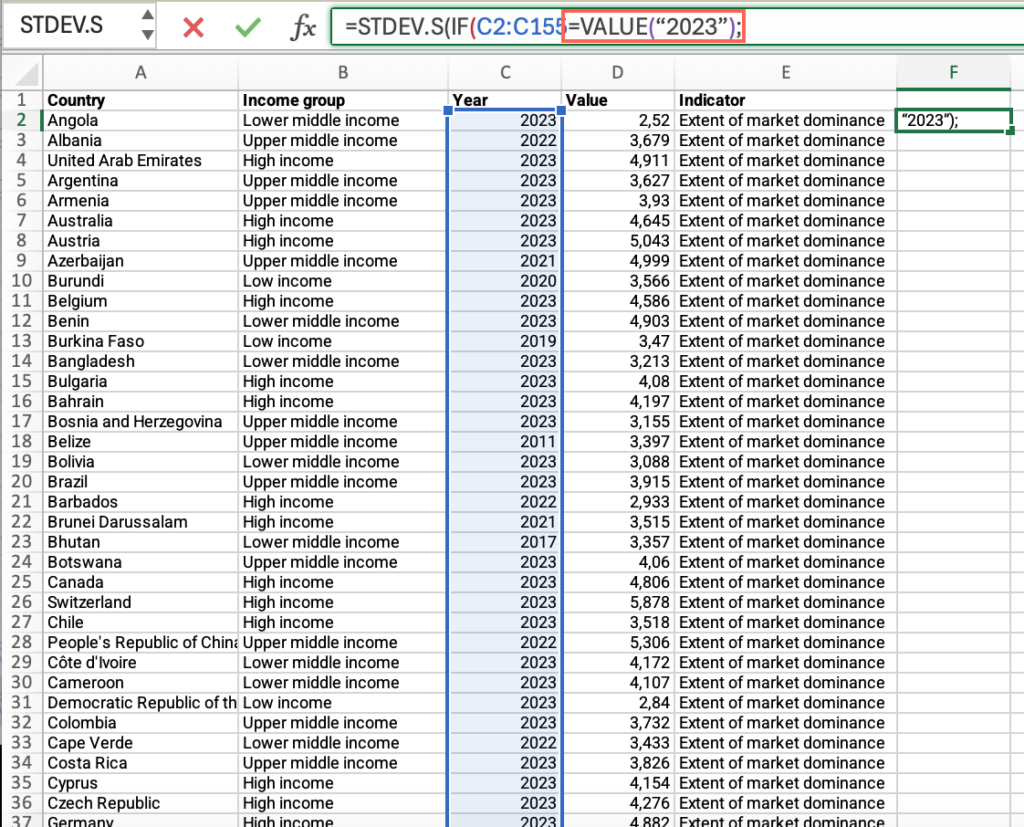
- Continue typing the formula in the bar and add
=VALUE(“latest_available_year”);. For example, if the latest available year is 2023, type=VALUE(“2023”);
- Click and drag to select the entire range of cells in the “value” column.
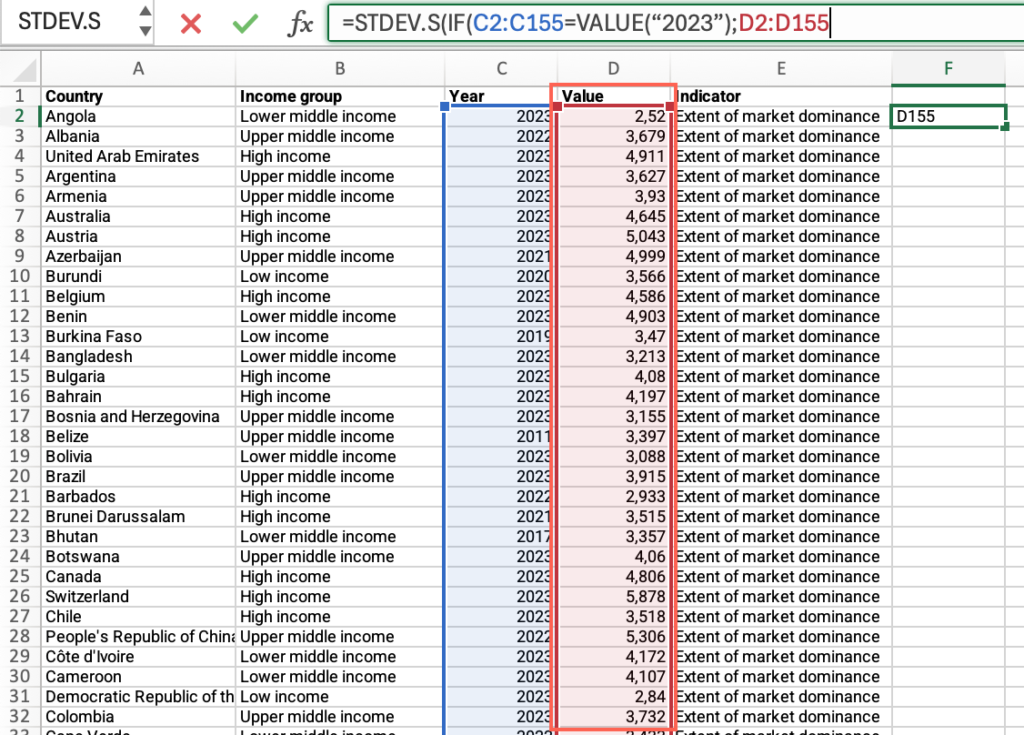
Type ;””))to close the formula.
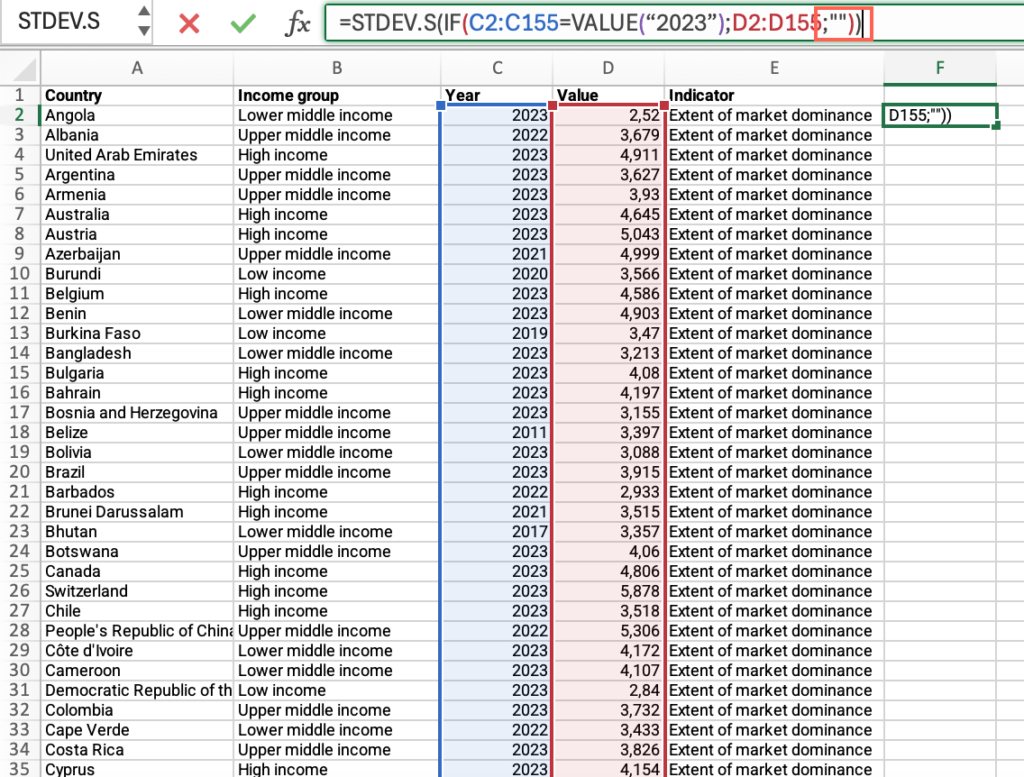
- Press Enter > Find the value in the cell you had selected.
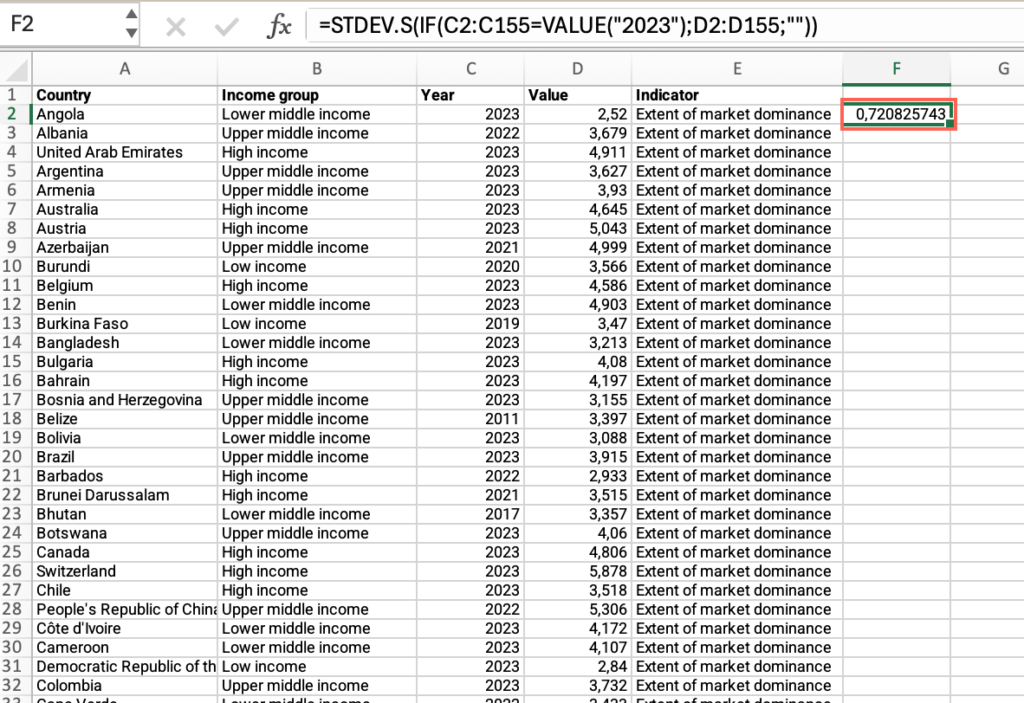
- From the world average, subtract the standard deviation and answer the question on the platform.
Step 1: Is your country’s score in the Extent of Market Dominance indicator below the average for countries within the same income group?
- In the “Step 1 – WEF – Market dominance” sheet, locate the “Country” column. If you have filtered for your country, apply the filter > Check “Select All”.
- Locate the “Income group” column > Filter by your country’s income group.
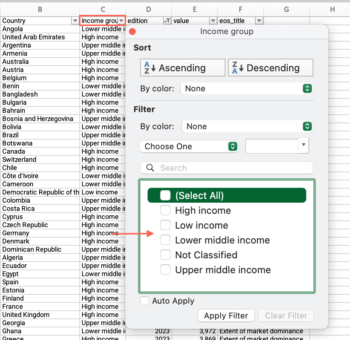
- Locate the “value” column > Click and drag to select the entire range of cells in the “value” column > Find the average at the bottom of the sheet, compare it with your country’s score and answer the question on the platform.
Step 2: Does the Bank concentration percentage exceed 60%?
- In the M3 – Step-by-step guide to analyze limited competition – databases Excel file, open the “Step 2-GFD-Bank concentration” sheet.
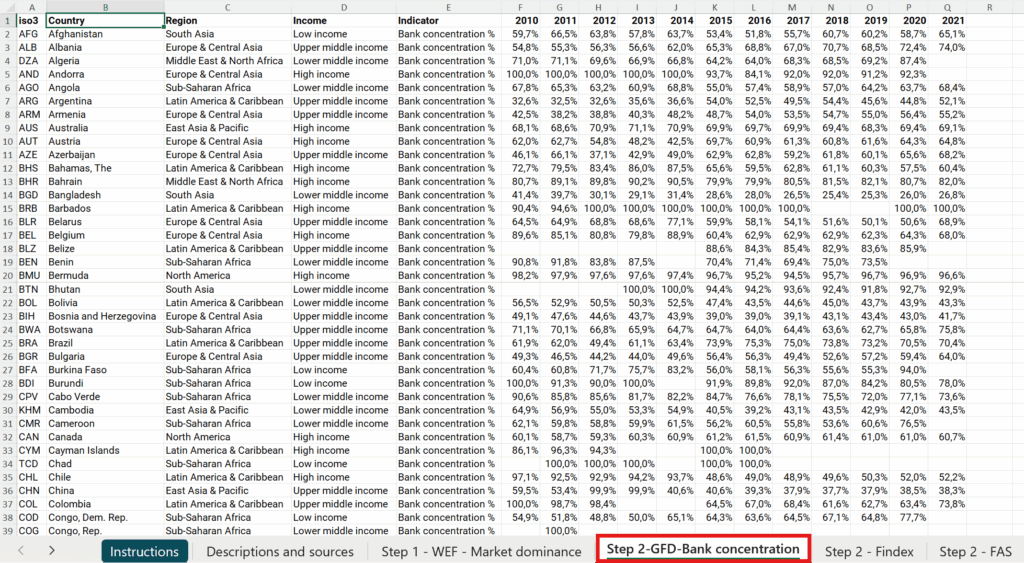
- Locate the “country” column > Filter by your country.
- In your country’s row, find the most recent value. To do this, scan the year columns from right to left and find the first number. This is the most recent bank concentration percentage.

- Now, compare that value to 60.
- If your value is greater than 60, the answer is Yes. If your value is 60 or less, the answer is No
Step 2: Has the bank concentration percentage decreased, indicating an improvement over the years?
- In the filtered “Step 2-GFD-Bank concentration” sheet, first find the most recent value for your country (scan the row from right to left). Write this number down.
- Next, find the oldest available value in the same row (scan the row from left to right). Write this number down.
- Compare the two values you found. If the most recent value is lower than the oldest value, it means the concentration has decreased. In this case, the answer is Yes. Otherwise, the answer is No.

Step 2: How would you characterize your country’s bank concentration indicator relative to account ownership?
- In the M3 – Step-by-step guide to analyze limited competition – databases Excel file, open the “Step 2 – Findex” sheet.
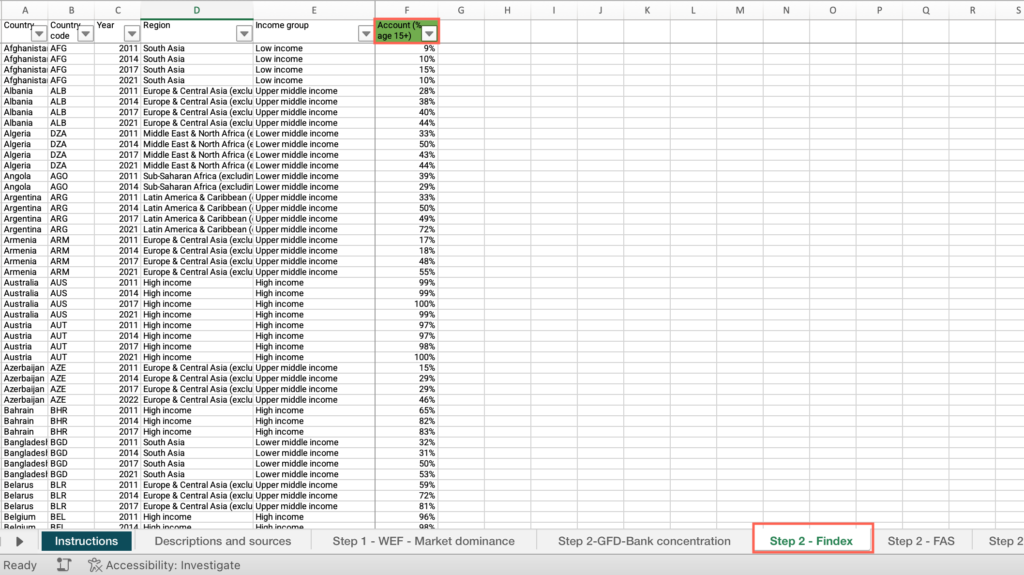
- Locate the “Country” column > Filter by your country.
- Locate the “Account (% age 15+)” column > Find the value > Use the provided definitions to interpret the values for both the account ownership and bank concentration indicators and answer the question on the platform.
Note: You can also find the value for account ownership in your responses to the “What is the situation of financial inclusion” assignment from Module 1.
Step 2: Has there been an increase in the number of ATMs per 100,000 adults over the years?
- In the M3 – Step-by-step guide to analyze limited competition – databases Excel file, open the “Step 2 – FAS” sheet.
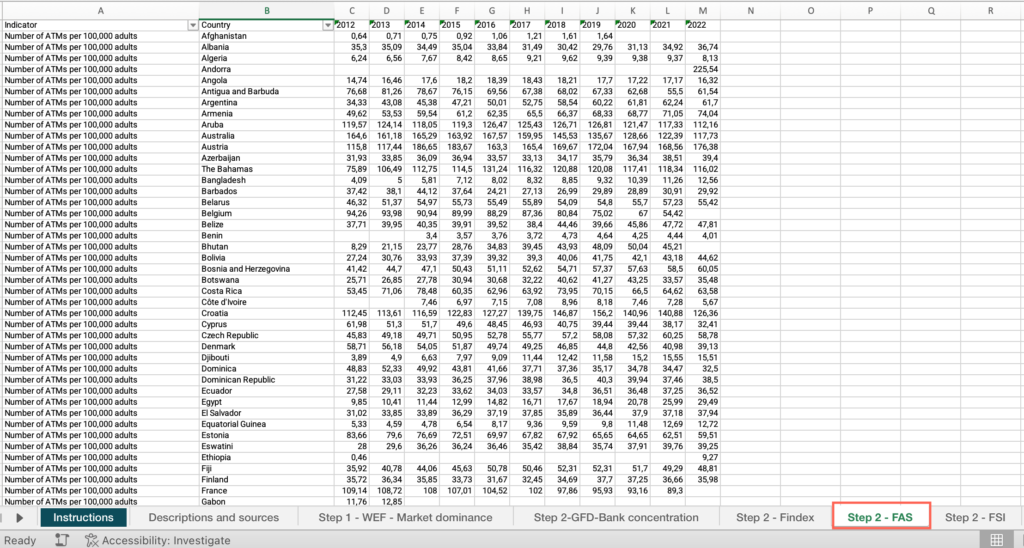
- Locate the “Country” column > Filter by your country.
- Locate an empty cell outside the data range, not associated with any row or column containing data > Click on the empty cell.
- Click the Insert menu > Locate the charts icons > click “Line” > select “Line with markers.”
- Click on the chart area > Click the Chart Design menu > Click “Select data.”
- Make sure the “Show data in hidden rows and columns” checkbox from the “Hidden and Empty Cells” options is unmarked.
- Click on the + sign to add a series > In the “Name” field, type “Number of ATMs over time.”
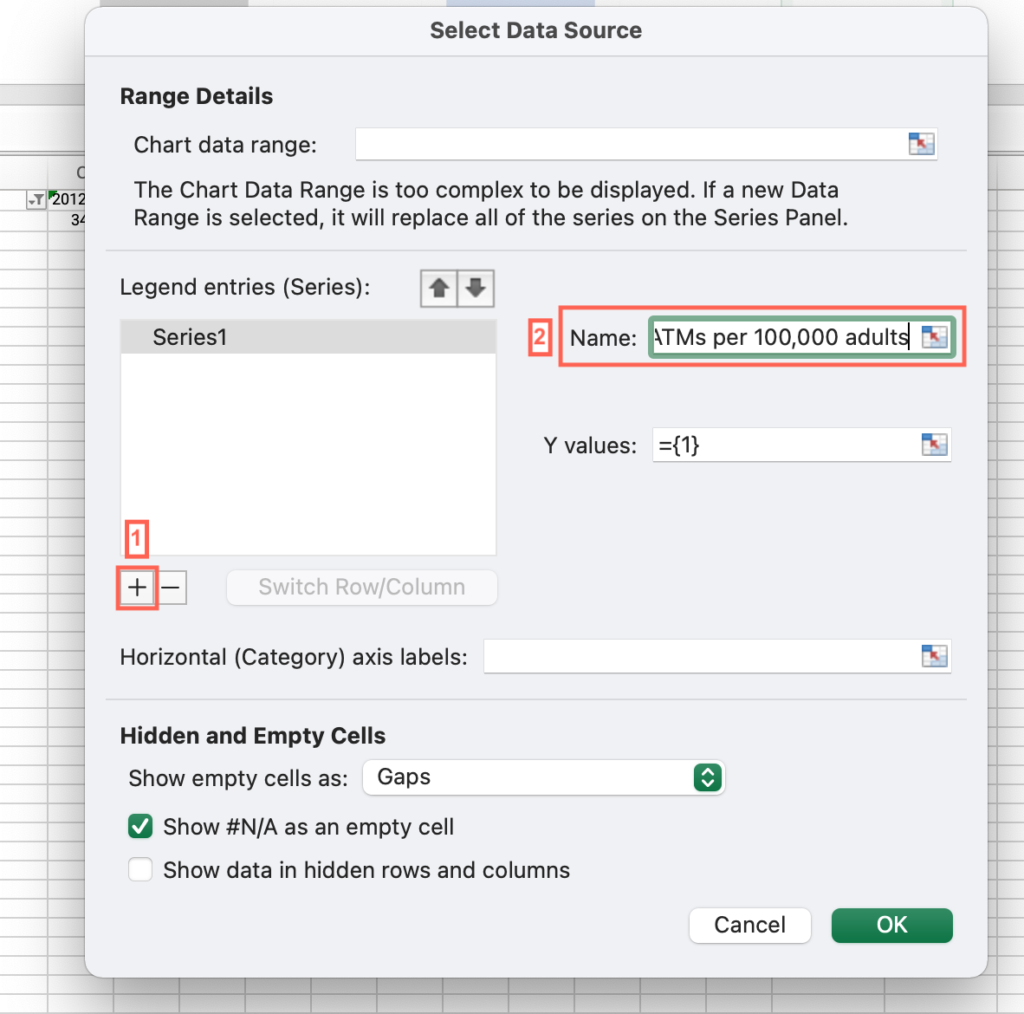
- Click the “Y Values” field > Select all cells with values for the “Number of ATMs per 100,000 adults” indicator.
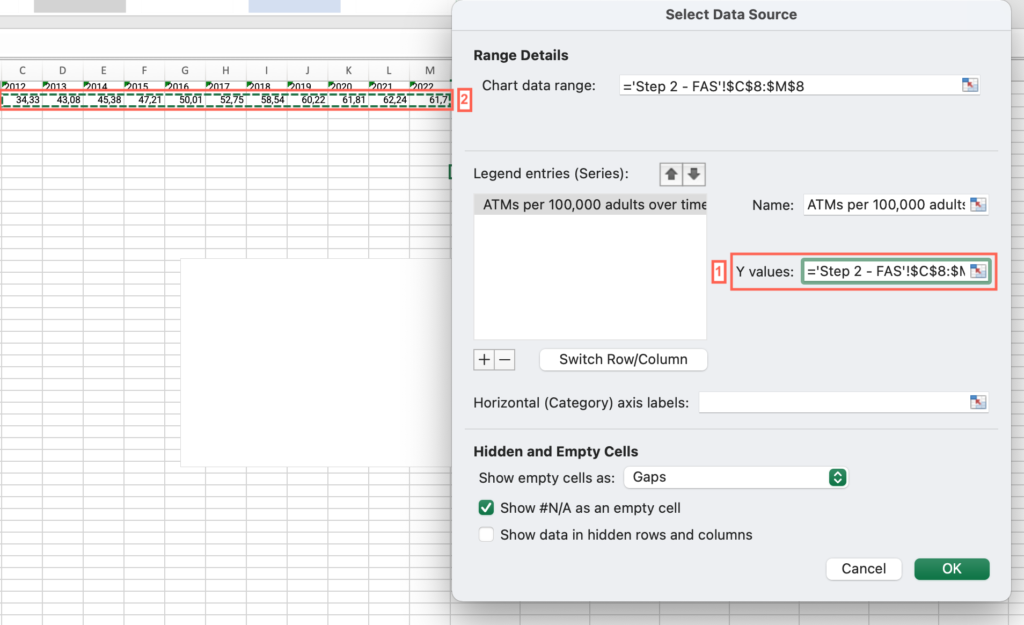
- Press “OK.”
- Click the “Horizontal (categories) x axis labels field>Select all years for which there are values for the “Number of ATMs per 100,000 adults” indicator.
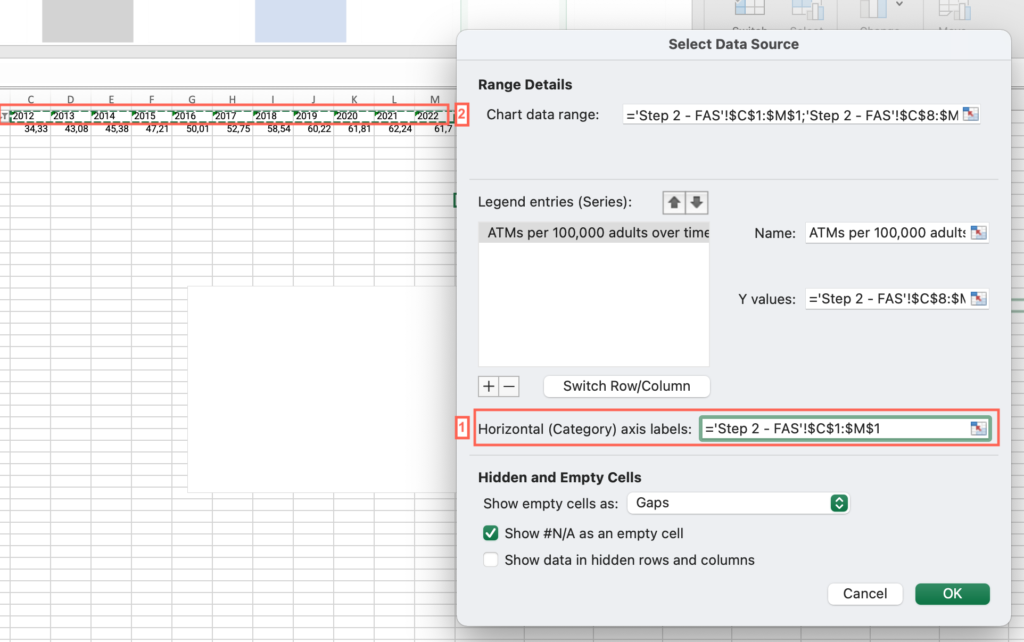
- Press “OK.”
- Analyze the output and answer the question on the platform.
Step 2: How has the non-interest expenses to gross income ratio behaved in your country over the last years?
- In the M3 – Step-by-step guide to analyze limited competition – databases Excel file, open the “Step 2 – FSI” sheet.
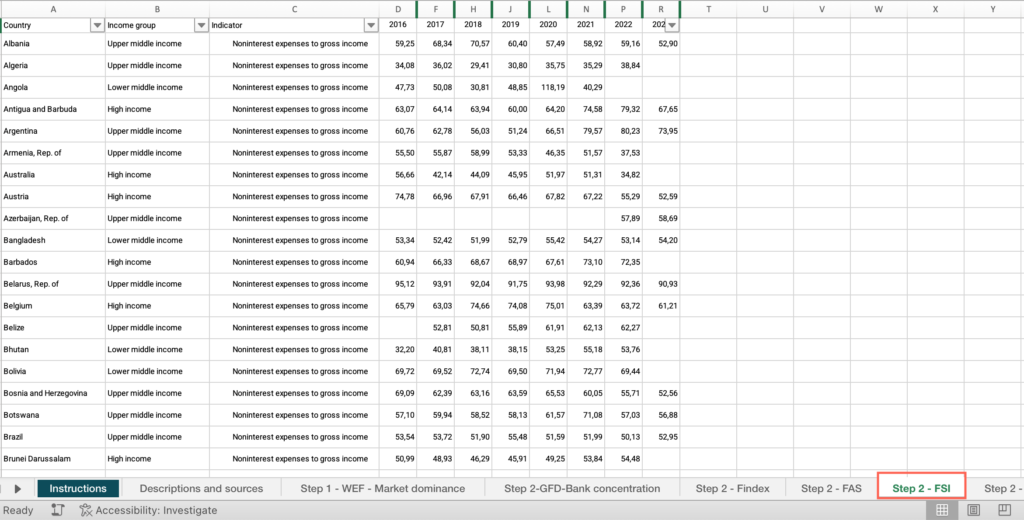
- Locate an empty cell outside the data range, not associated with any row or column containing data > Click on the empty cell.
- Click the Insert menu > Locate the charts icons > click “Line” > select “Line with markers.”
- Click on the chart area > Click the Chart Design menu > click “Select data.”
- Make sure the “Show data in hidden rows and columns” checkbox from the “Hidden and Empty Cells” options is unmarked.
- Click on the + sign to add a series > In the “Name” field, type “Non-interest expenses to gross income over time.”
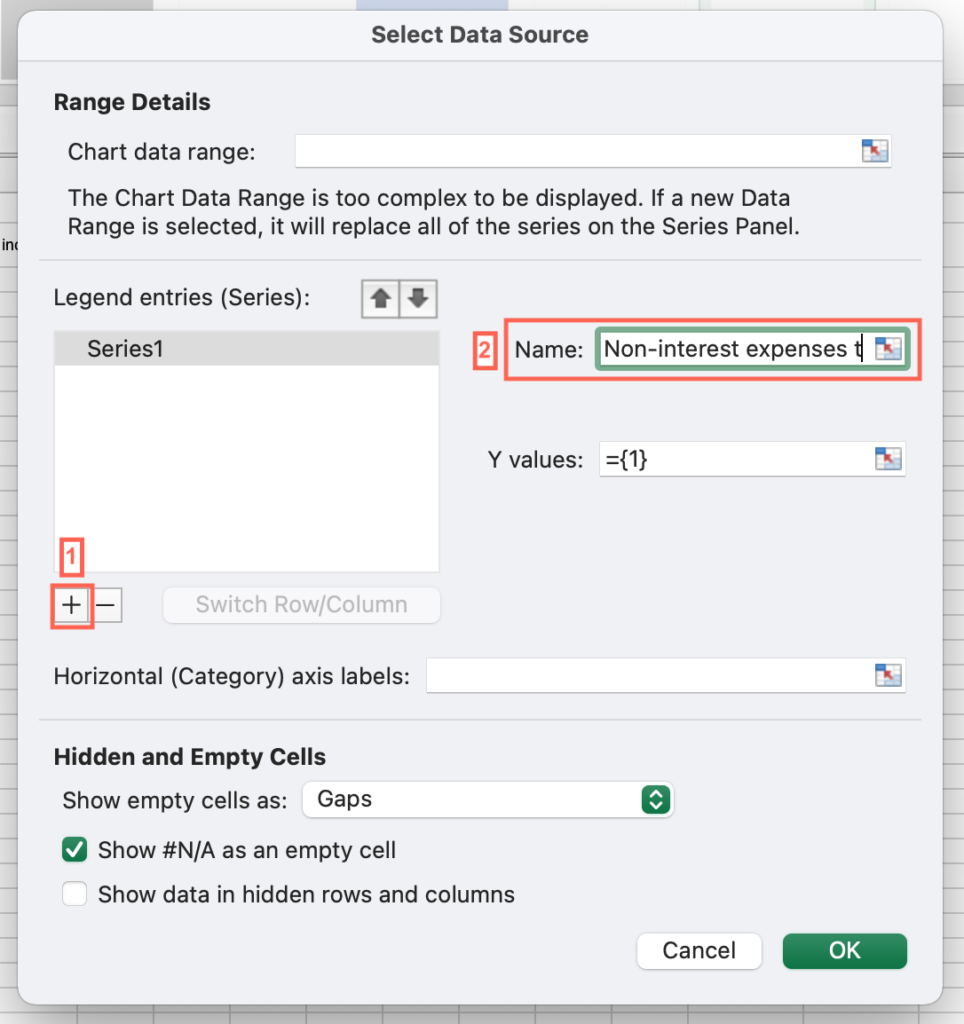
- Click the “Y Values” field > Select all cells with values for the “Non-interest expenses to gross income” indicator.
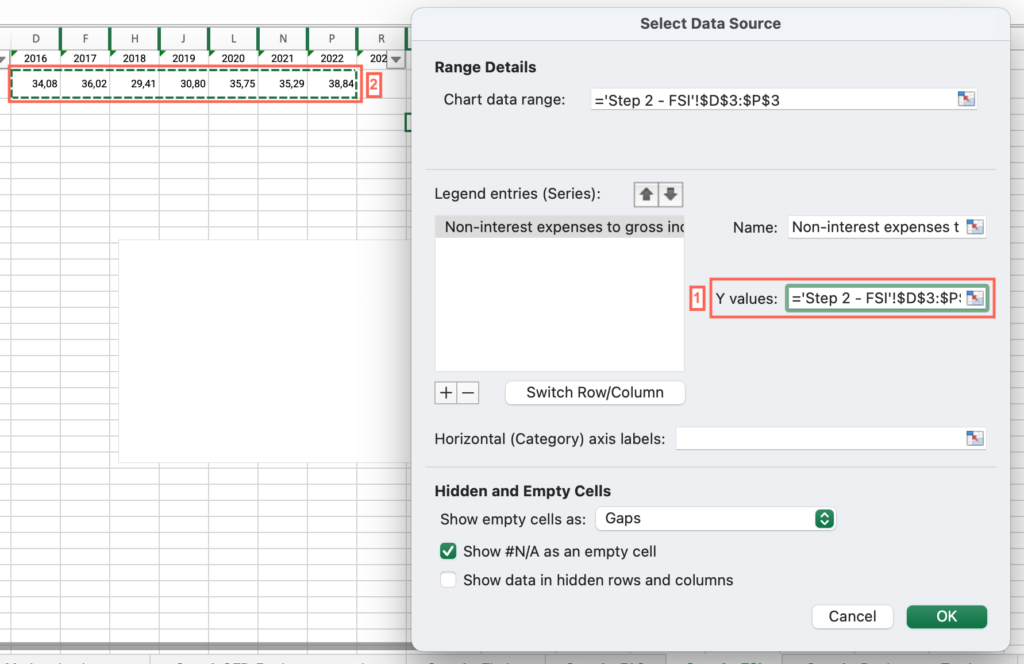
- Press “OK.”
- Click the “Horizontal (categories) x axis labels field>Select all years for which there are values for the “Non-interest expenses to gross income” indicator.
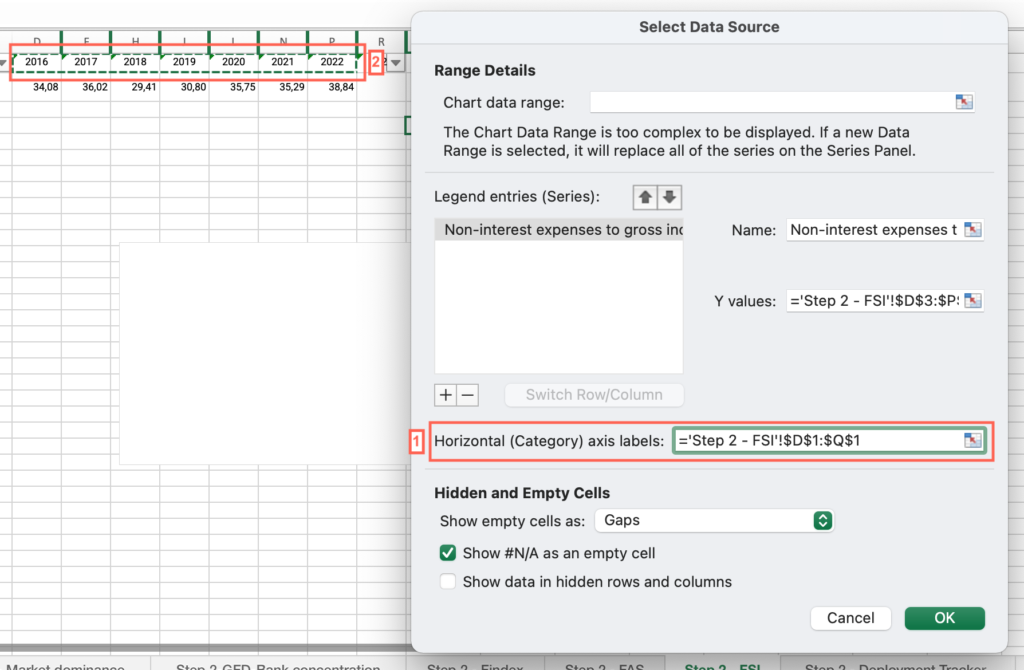
- Press “OK.”
- Analyze the output and answer the question on the platform.
Step 2: How does the non-interest expenses to gross income ratio compare to the average of high-income countries (advanced economies)?
- In the M3 – Step-by-step guide to analyze limited competition – databases Excel file, open the “Step 2 – FSI” sheet.
- If you have applied the filter by your country, locate the “Country” column > Apply the filter > Check “Select all.”
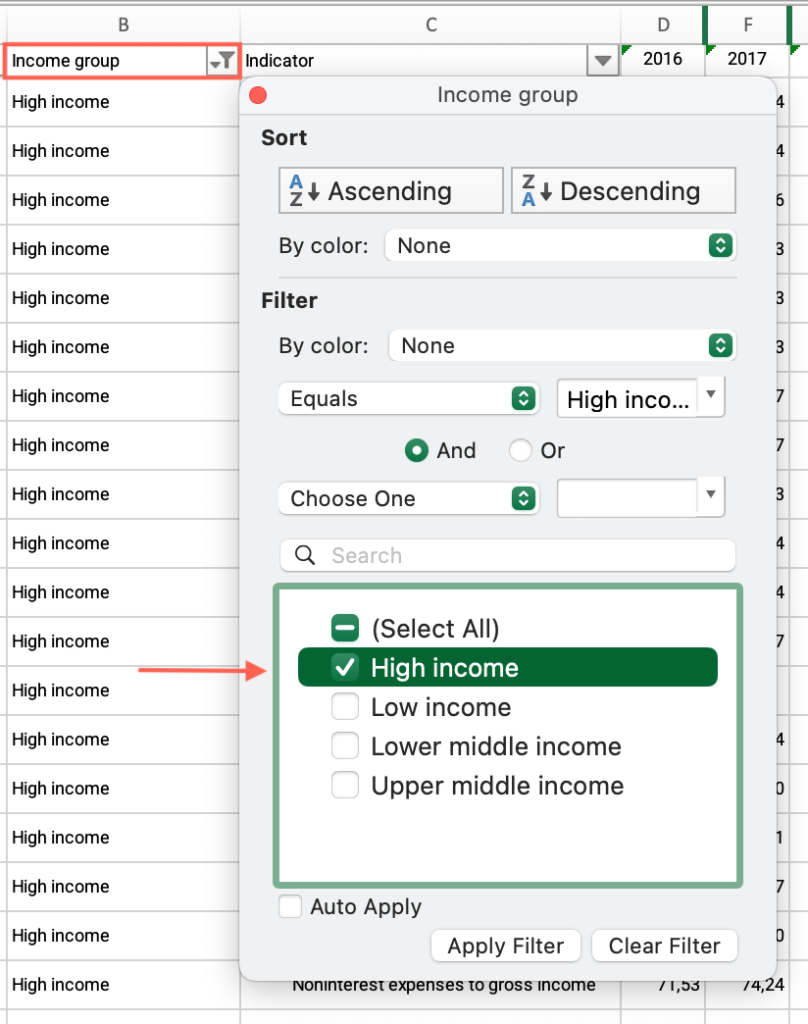
- Locate the “Income group” column > Filter by “High-income.”
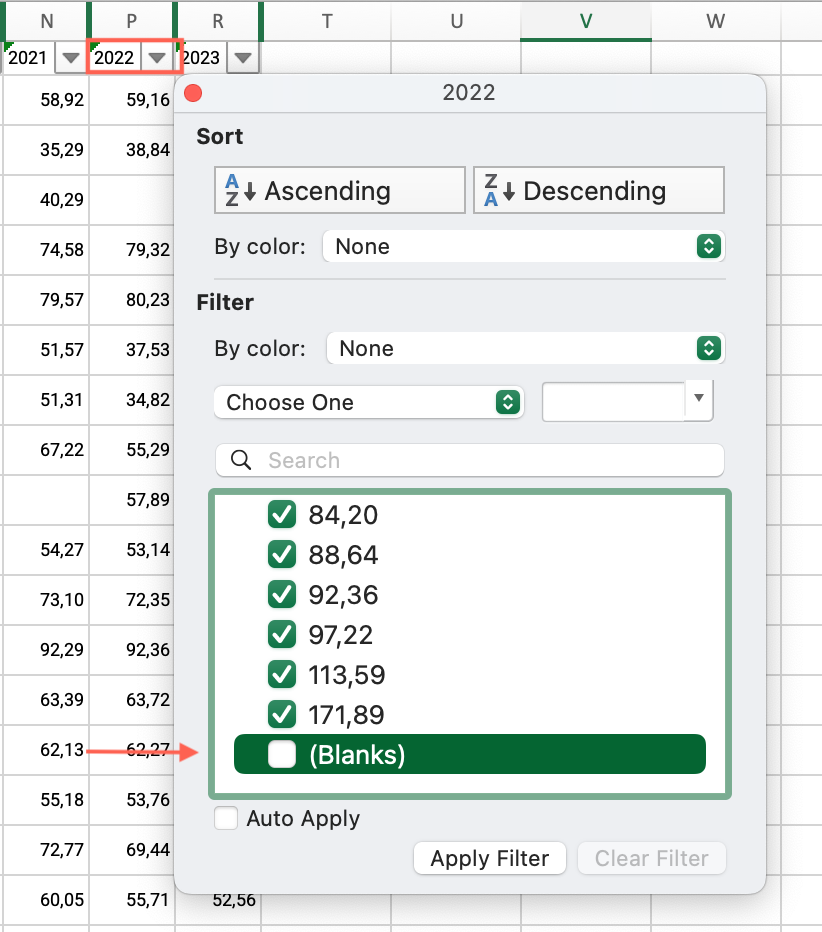
- Locate the column for the most recent year of available data for your country > Apply the filter > Uncheck “Blanks.”
- Click and drag to select the entire range of cells under this column > Find the average at the bottom of the sheet, compare it with your country’s score and answer the question on the platform.
Step 2: How does the non-interest expenses to gross income ratio compare to countries within your same income group?
- In the M3 – Step-by-step guide to analyze limited competition – databases Excel file, open the “Step 2 – FSI” sheet.
- If you have applied the filter by your country, locate the “Country” column > Apply the filter > Check “Select all.”
- Locate the “Income group” column > Filter by your income group.
- Locate the column for the most recent year of available data for your country > Apply the filter > Uncheck “Blanks.”
- Click and drag to select the entire range of cells under this column > Find the average at the bottom of the sheet, compare it with your country’s score and answer the question on the platform.
Step 2: From the list of 9 possible mobile money payment services, how many are currently available in your country through any provider?
- In the M3 – Step-by-step guide to analyze limited competition – databases Excel file, open the “Step 2 – Deployment Tracker” sheet.
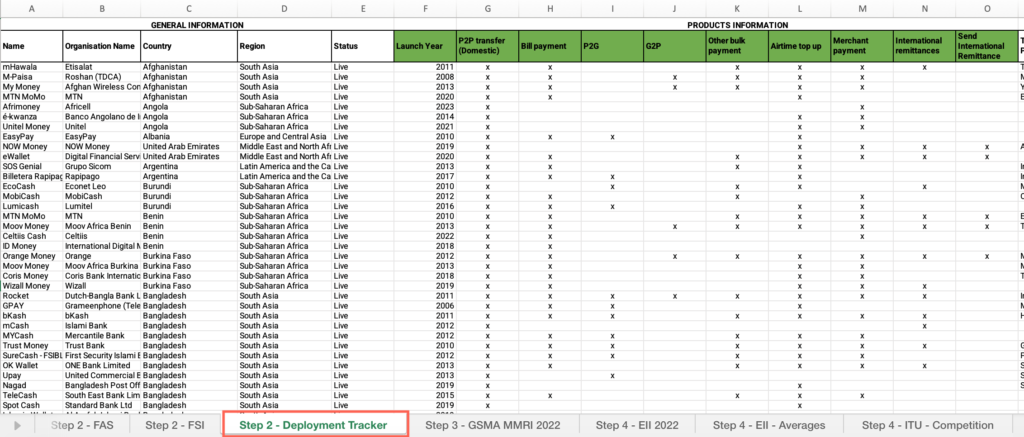
- Locate the “Country” column > Filter by your country.
- Locate the payment services (highlighted in green) > Find the number of currently available services and answer the question on the platform.
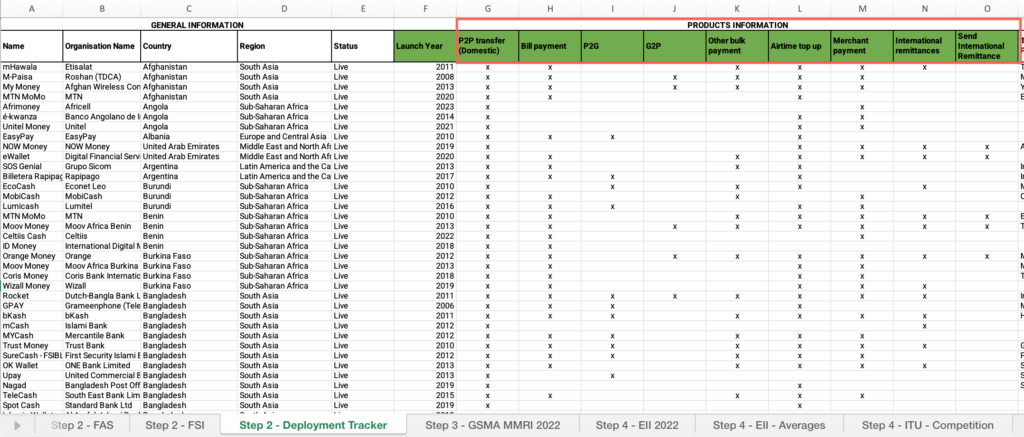
Step 2: How would you characterize the dynamism of the market for mobile money services?
- In the M3 – Step-by-step guide to analyze limited competition – databases Excel file, open the “Step 2 – Deployment Tracker” sheet.
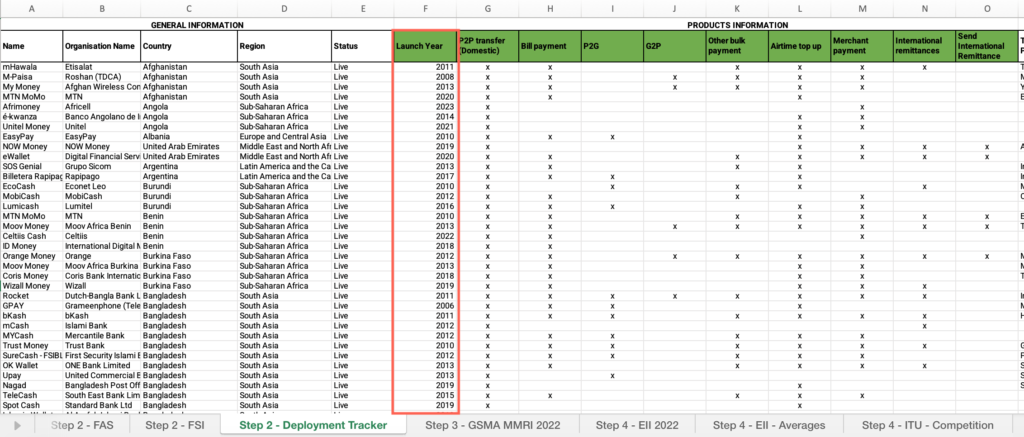
- Locate the “Country” column > Filter by your country.
- Locate the “Launch year” column > Find the launch years for each provider and answer the question on the platform.
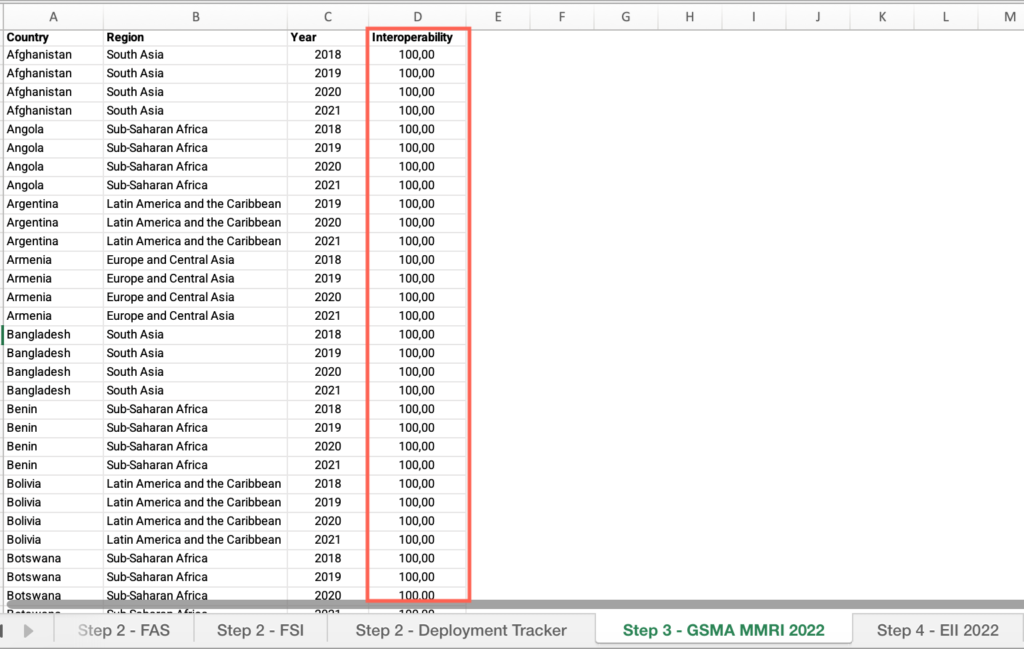
Step 3: Does your country’s regulation prescribe specific technical standards for interoperability?
- In the M3 – Step-by-step guide to analyze limited competition – databases Excel file, open the “Step 3 – GSMA MMRI 2022” sheet.
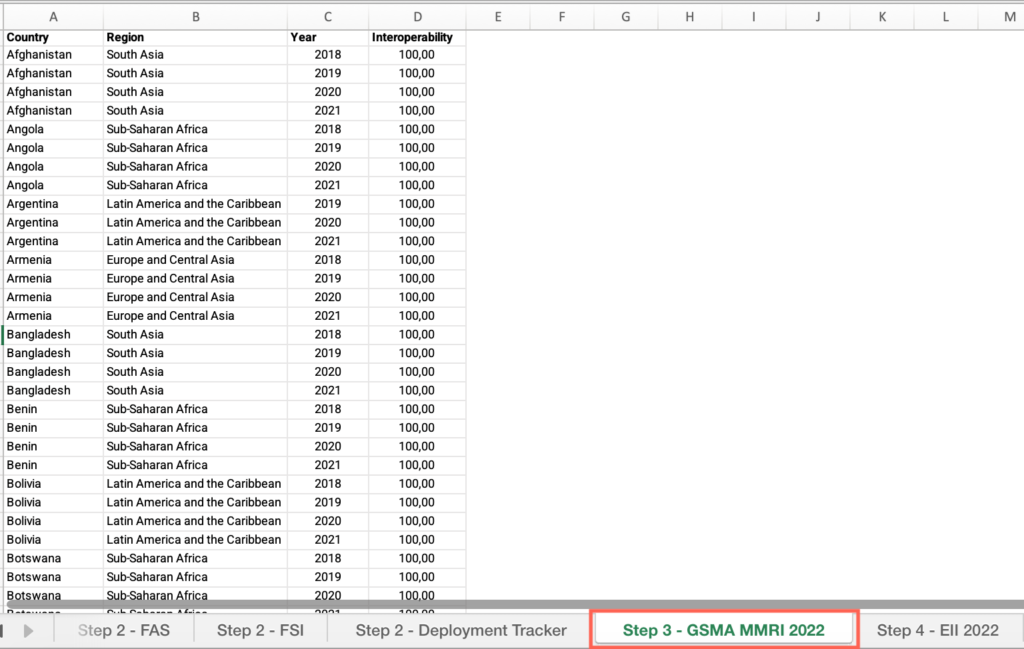
- Locate the “Country” Column > Filter by your country.
- Locate the “Year”column > Filter by the most recent year.
- Locate the “Interoperability” column > Find the value and answer the question on the platform.
Step 4: Is the competitive environment for internet access and usage in your country lower than the world average?
- In the M3 – Step-by-step guide to analyze limited competition – databases Excel file, open the “Step 4 – EII 2022” sheet.
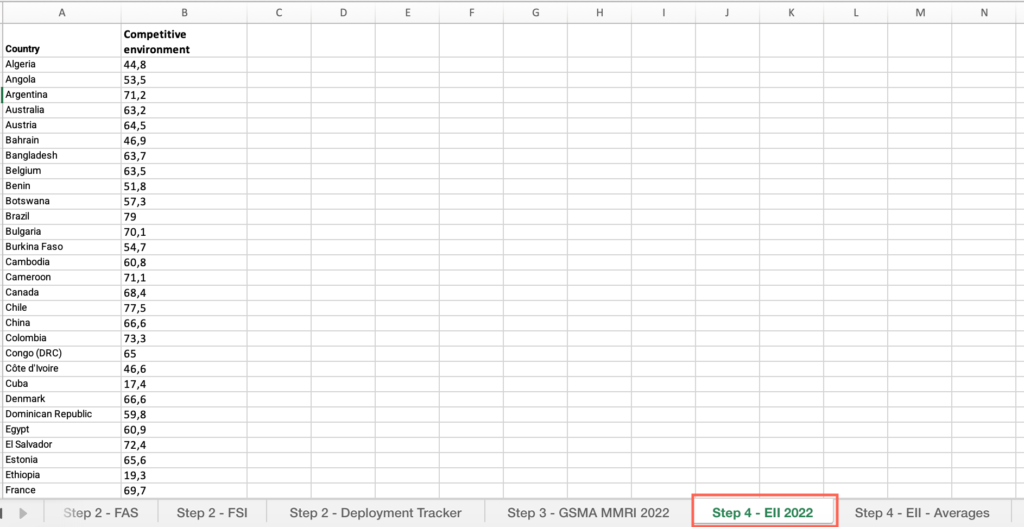
- Locate the “Country” Column > Filter by your country.
- Locate the “Competitive environment” indicator > Find the value.
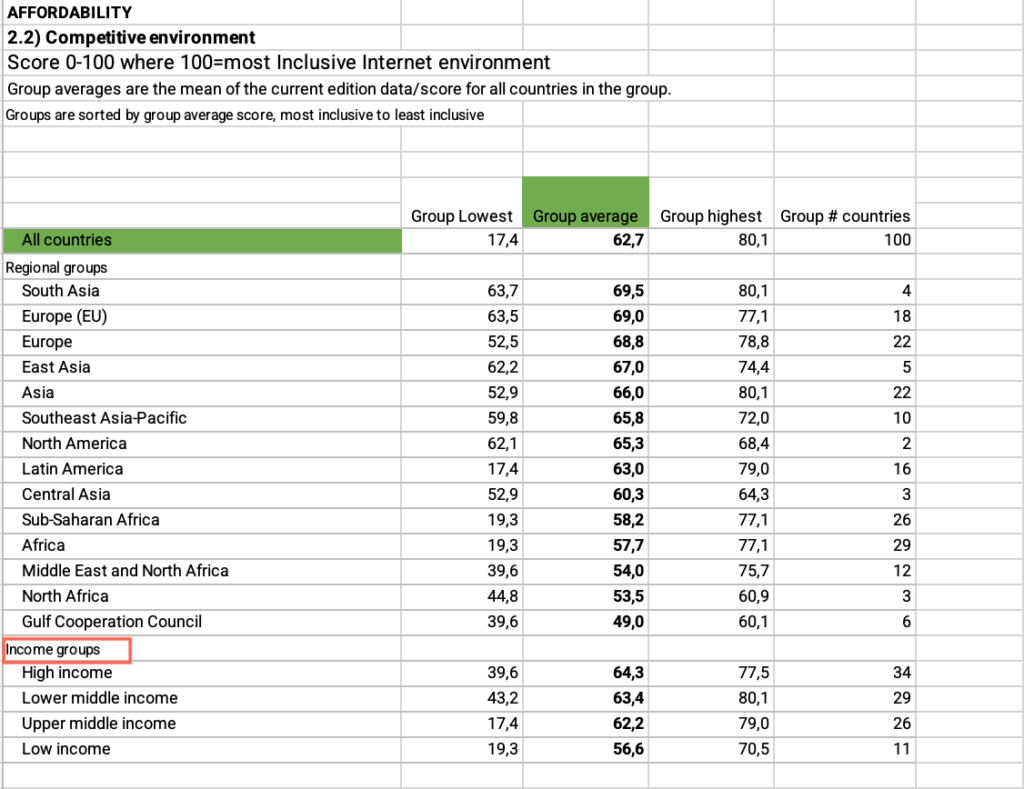
- In the M3 – Step-by-step guide to analyze limited competition – databases Excel file, open the “Step 4 – EII – Averages” sheet.
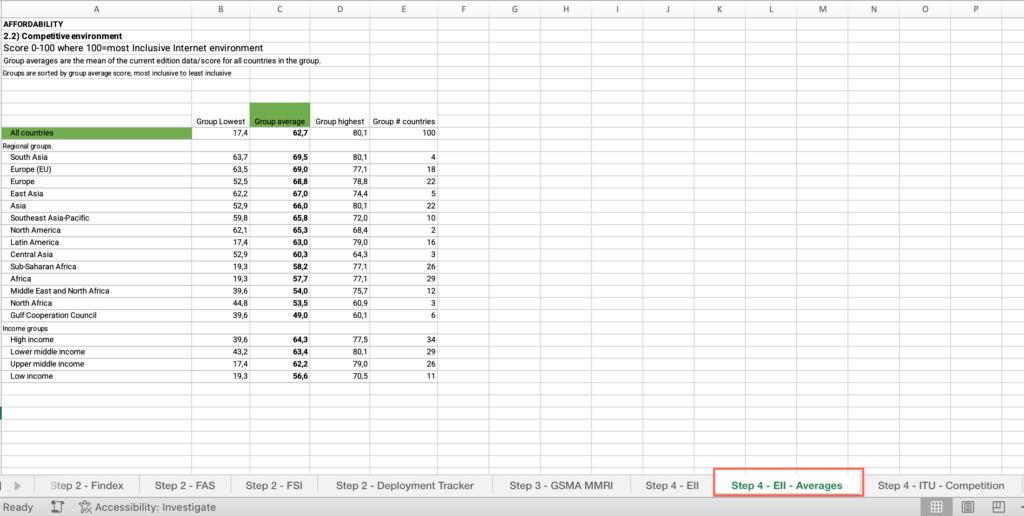
- Locate the “All countries” cell > Locate the “Group average” column > Find the value, compare it with your country’s score and answer the question on the platform.
Step 4: Is the competitive environment for internet access and usage in your country lower than your income group average?
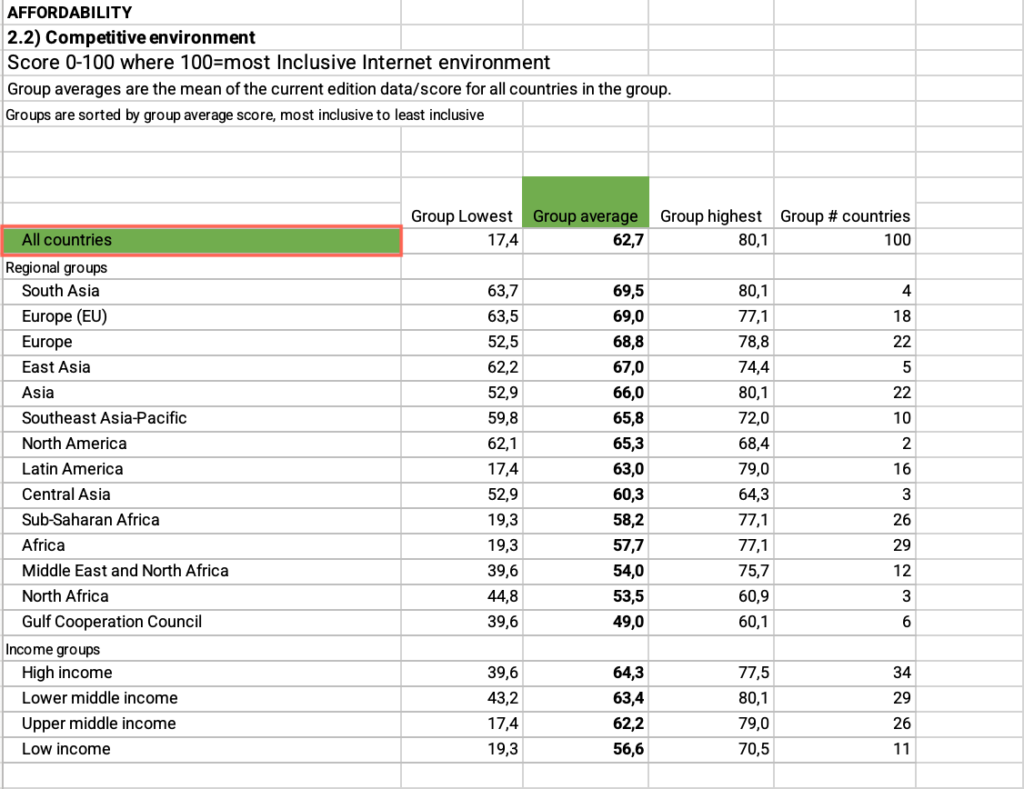
- In the M3 – Step-by-step guide to analyze limited competition – databases Excel file, open the “Step 4 – EII – Averages” sheet.
- Locate the “Income groups” cell > Find your income group > Locate the “Group average” column > Find the value at the bottom of the sheet, compare it with your country’s score and answer the question on the platform.
Step 4: Does your country regularly review its competition framework to ensure its effectiveness in promoting competition in the telecommunications and ICT sector?
- In the M3 – Step-by-step guide to analyze limited competition – databases Excel file, open the “Step 4 – ITU – Competition” sheet.
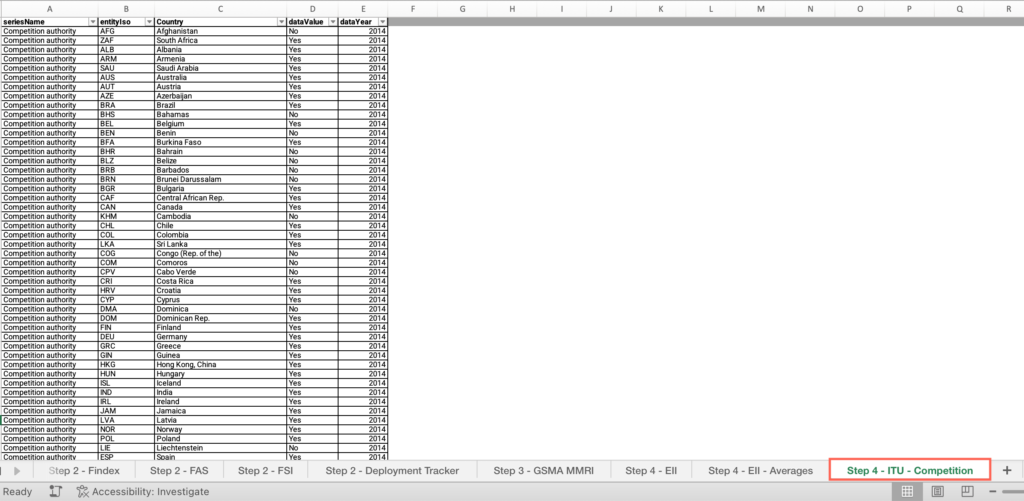
- Locate the “Country” column > Filter by your country.
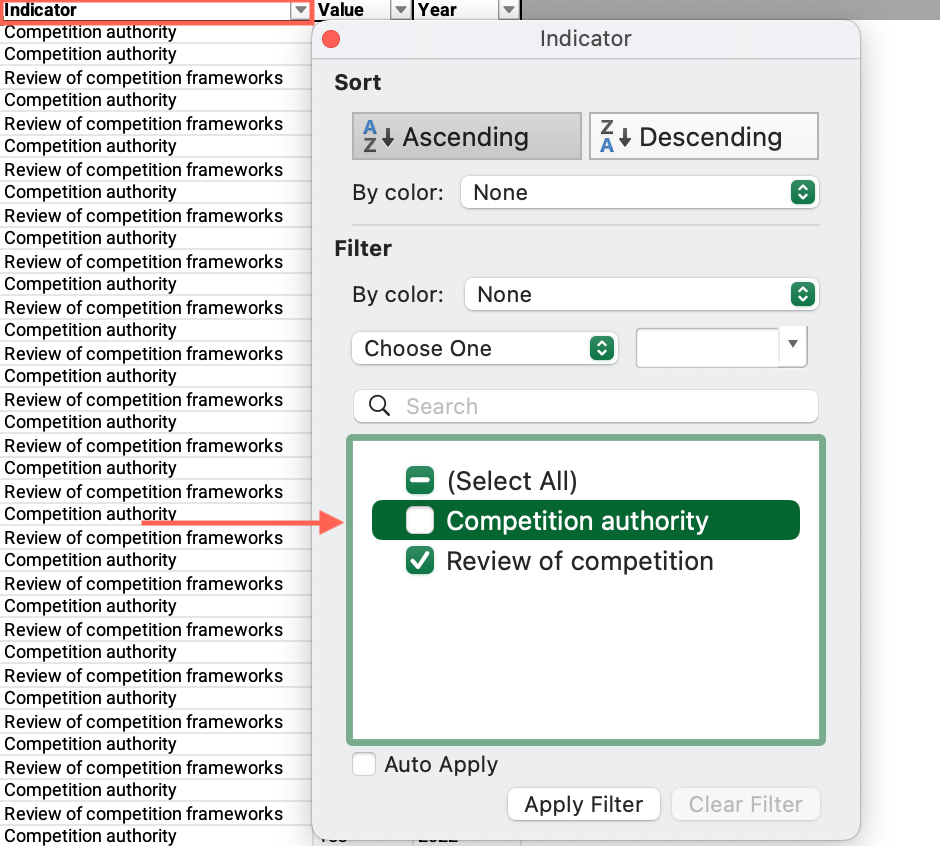
- Locate the “Indicator” column > Filter by “Review of competition frameworks.”
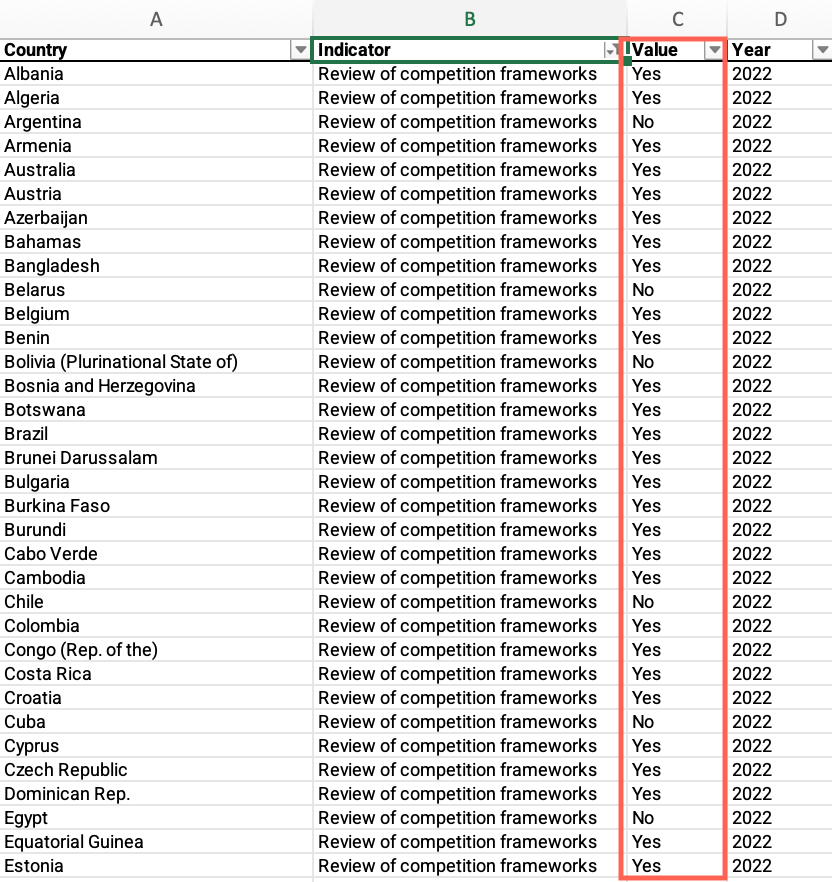
- Locate the “Value” column > Find the value and answer the question on the platform.
Step 4: Does your country have a designated competition authority responsible for overseeing competition in the ICT sector?
- In the M3 – Step-by-step guide to analyze limited competition – databases Excel file, open the “Step 4 – ITU – Competition” sheet.
- Locate the “Country” column > Filter by your country.
- Locate the “Indicator” column > Filter by “Competition Authority.”
- Locate the “Value” column > Find the value and answer the question on the platform.
