Module 5 Assignment – Excel Tutorials
The following tutorial is an optional resource meant to assist you in navigating the databases and collecting the necessary data for your analysis.
Note on recording your responses: In the assignment you will find all the necessary fields to record your answers and the data you collect. You will also find an optional Answer Sheet Excel file to keep record of the collected data and your findings. You will find this file in the assignment’s introduction.
STEP 1a: What is your country’s number of mobile subscribers per 100 inhabitants?
- Open the M5 Step-by-step guide to analyze digital infrastructure-databases Excel file > Open the “Step 1a – EII – data – 2022” sheet.
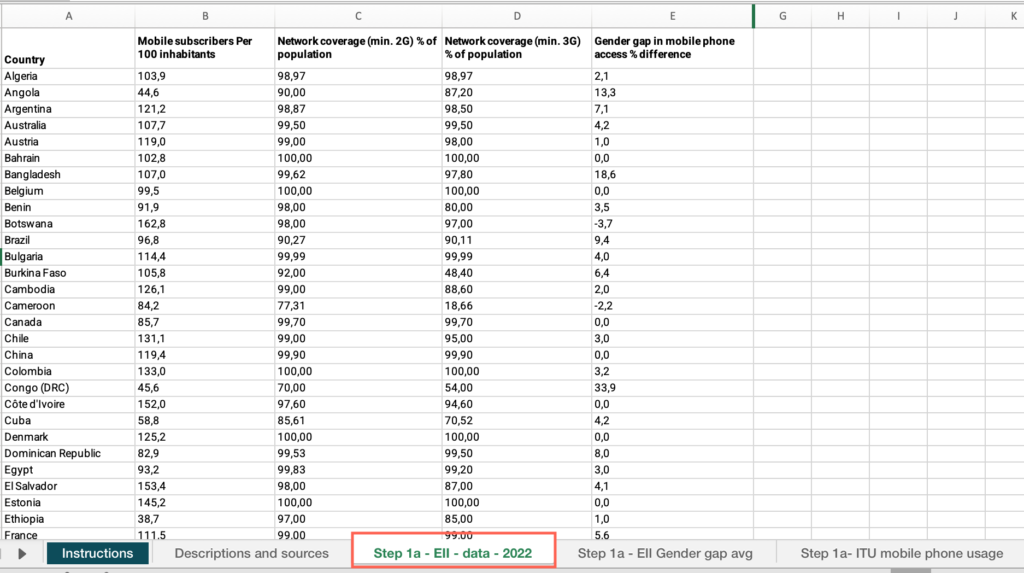
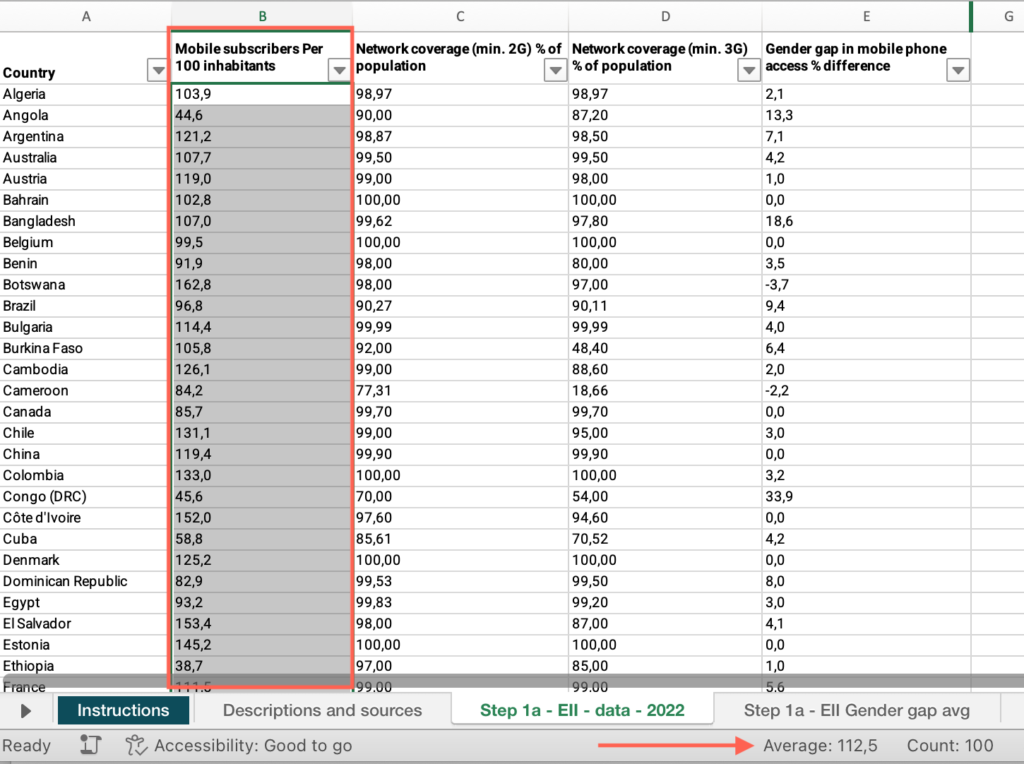
- Right-click on the status bar at the bottom of the Excel window. In the dialog box that appears, ensure that the checkbox for “Average” is checked.
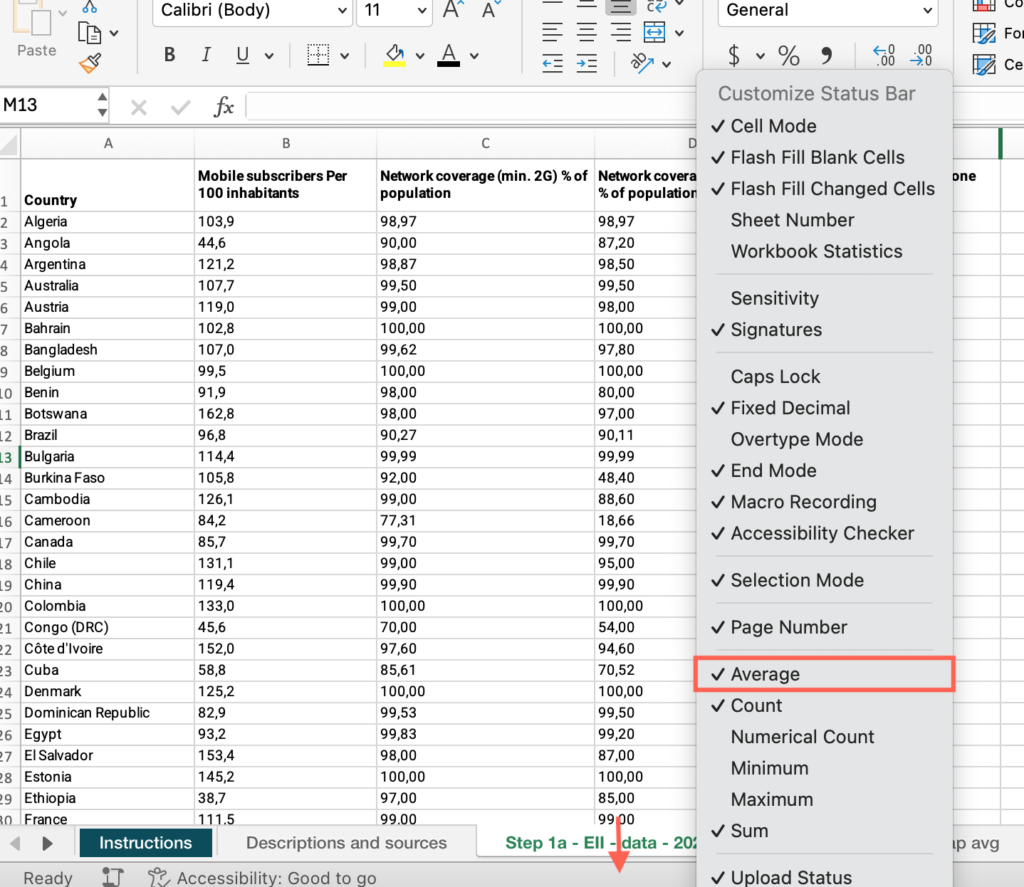
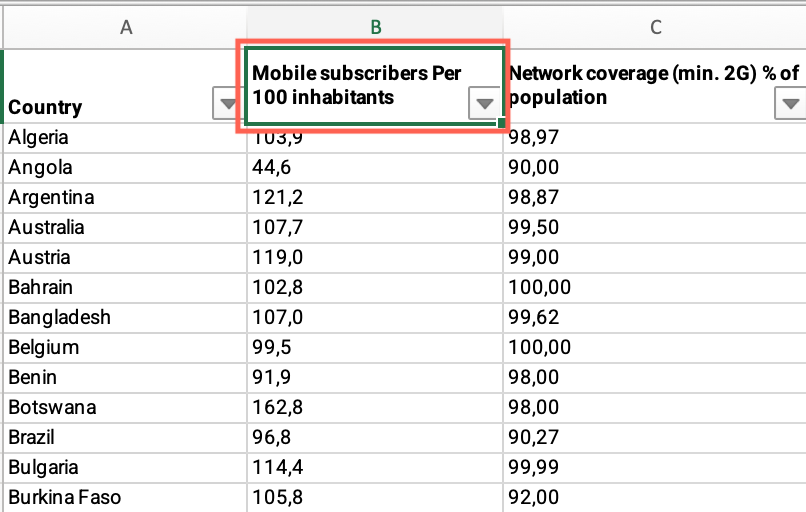
- Select the header row > Click the Data menu > Select “Filter”.
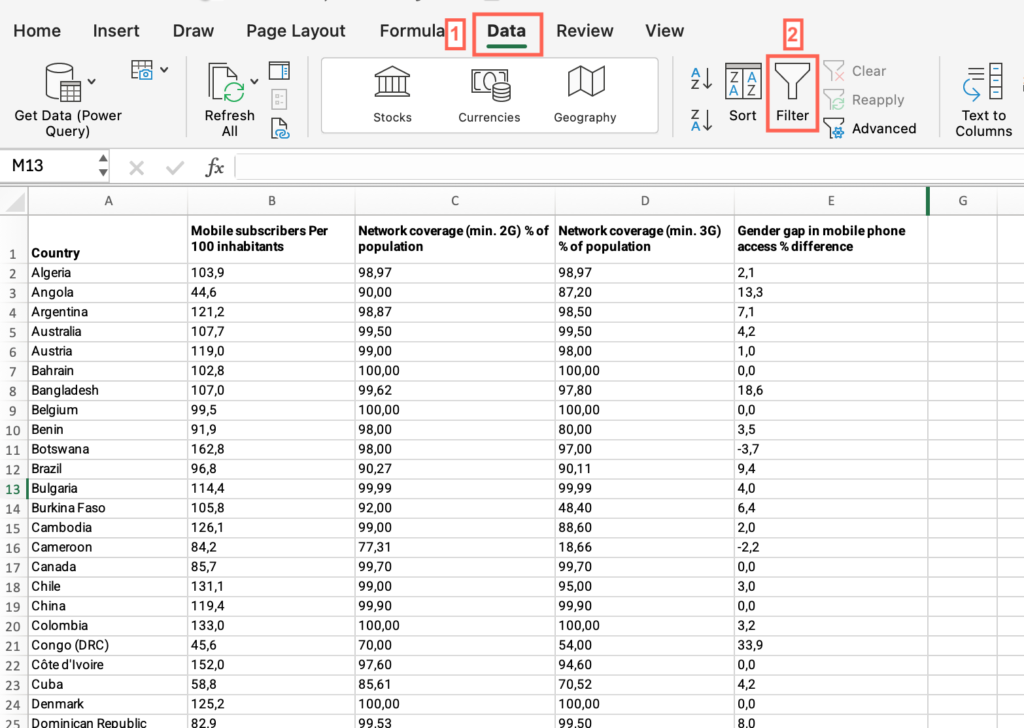
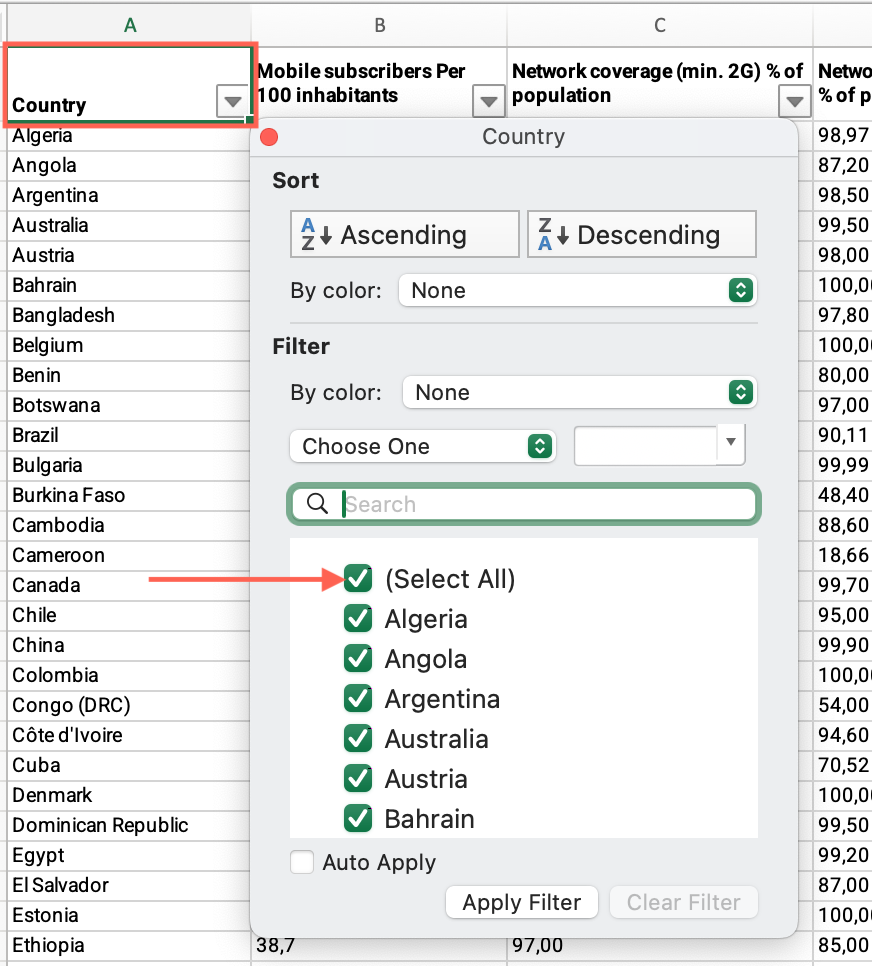
- Now that “Filter” is enabled, click on the dropdown arrow in the “Country” column header > Uncheck “Select All” > Check the box for your country.
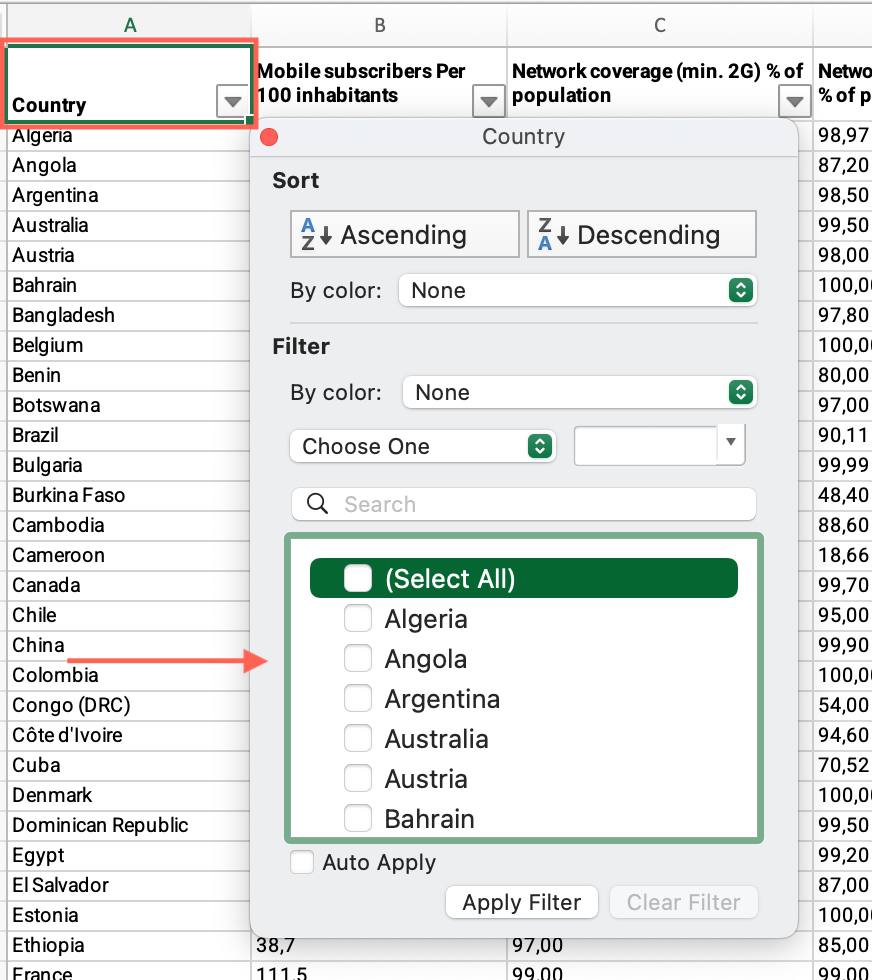
- Locate the “Mobile subscribers per 100 inhabitants” column > Find your country’s value > Answer the question on the platform.
STEP 1a: Is the value lower than the world’s average?
- Open the “Step 1a – EII – data – 2022” sheet.
- If you have applied the filter by your country, locate the “Country” column > Apply the filter > Check “Select all.”
- Locate the “Mobile subscribers per 100 inhabitants” column > Click and drag to select the entire range of cells under this column > Find the average at the bottom of the sheet and answer the question on the platform. ADD SCREENSHOT EII 7
STEP 1a: Does your country have at least 95% population coverage for 2G networks?
- In the “Step 1a – EII – data – 2022” sheet, locate the “Country” column > Apply the filter > Check the box for your country.
- Locate the “Network coverage (min. 2G) % of population” column > Find the value and answer the question on the platform.
STEP 1a: Does your country have at least 95% population coverage for 3G networks?
- Locate the “Network coverage (min. 3G) % of population” column > Find the value and answer the question on the platform.
STEP 1a: What is the gender gap in mobile phone access?
- In the “Step 1a – EII – data – 2022” sheet, locate the “Country” column > Apply the filter > Check the box for your country.
- Locate the “Gender gap in mobile phone access % difference” column > Find the value and answer the question on the platform.
STEP 1a: Is your country’s gender gap value higher than the estimated average for your income group?
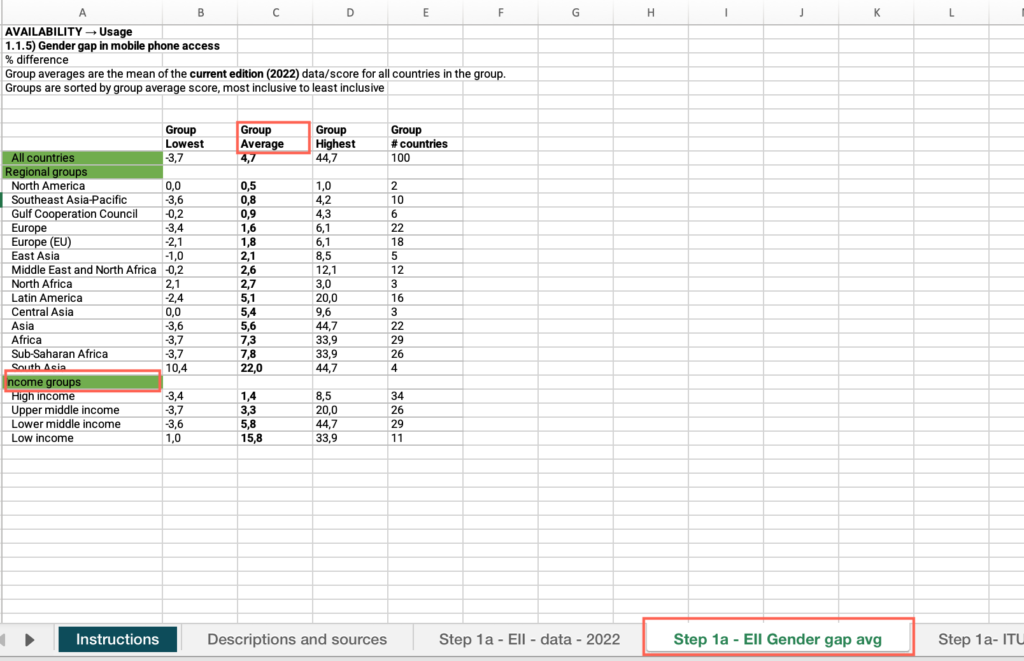
- Open the “Step 1a – EII – Gender gap av” sheet > Locate the “Income groups”cell > Find your income group > Locate the “Group average” column > Find the value, compare it with your country’s score and answer the question on the platform.
STEP 1a: Is your country’s gender gap value higher than the estimated average for your regional group?
- In the “Step 1a – EII – Gender gap av” sheet > Locate the “Regional groups”cell > Find your regional group > Locate the “Group average” column > Find the value, compare it with your country’s score and answer the question on the platform.
STEP 1a: Is there a significant location gap affecting rural population?
- Open the “Step 1a- ITU mobile phone usage” sheet > Locate the “Country” column > Uncheck “Select All” > Check the box for your country.
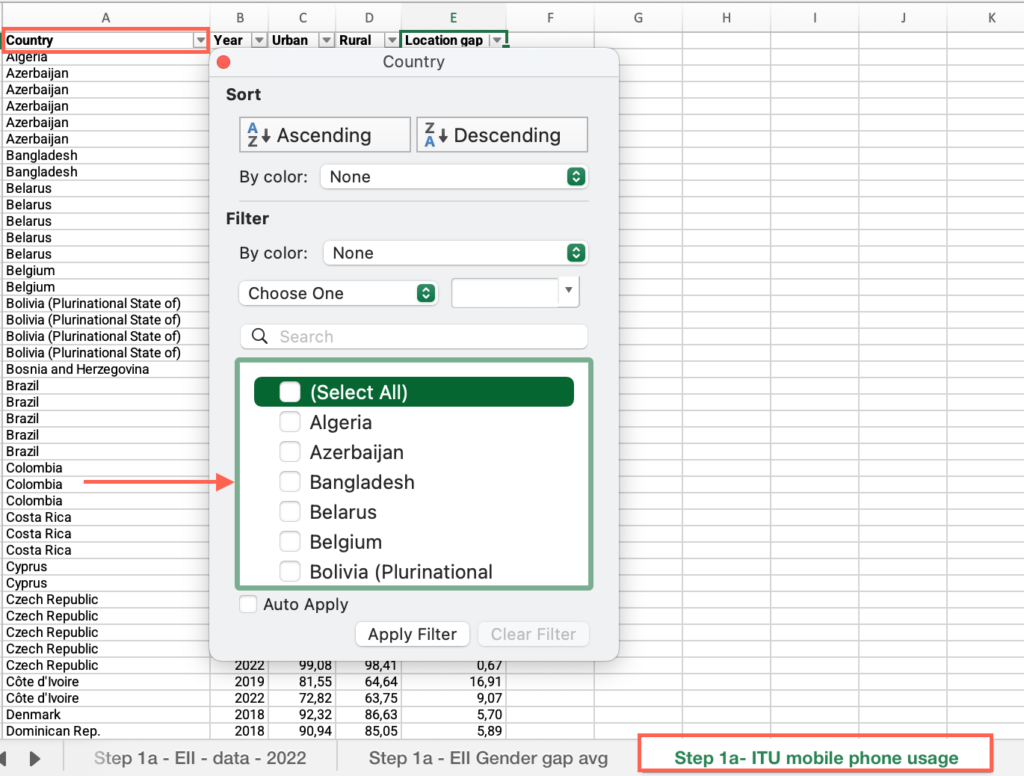
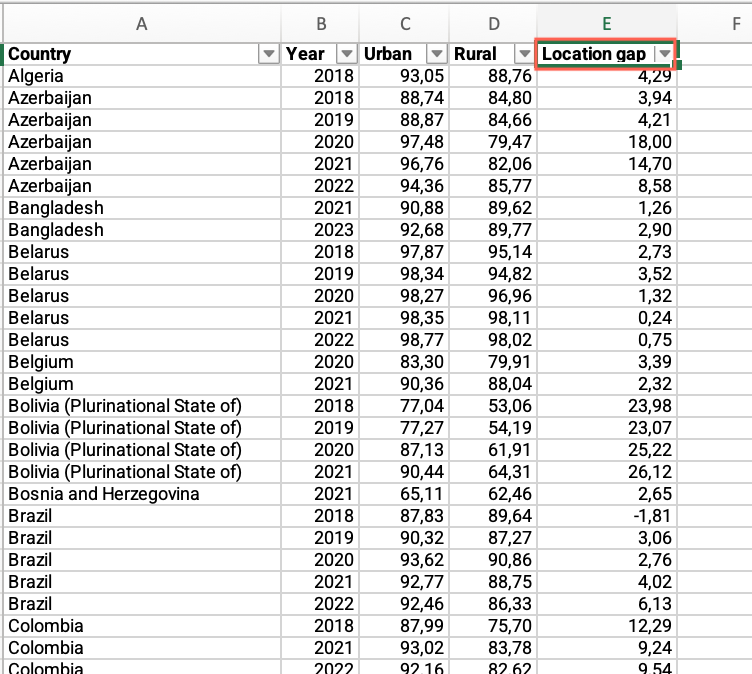
- Locate the “Year” column > Filter by the most recent year.
- Locate the “Location gap” column > Find the value and answer the question on the platform.
Step 1b: What is the percentage of households with internet?
- In the “Step 1b-EII Internet users 2022” sheet, locate the “Country” column > Apply the filter > Check the box for your country.
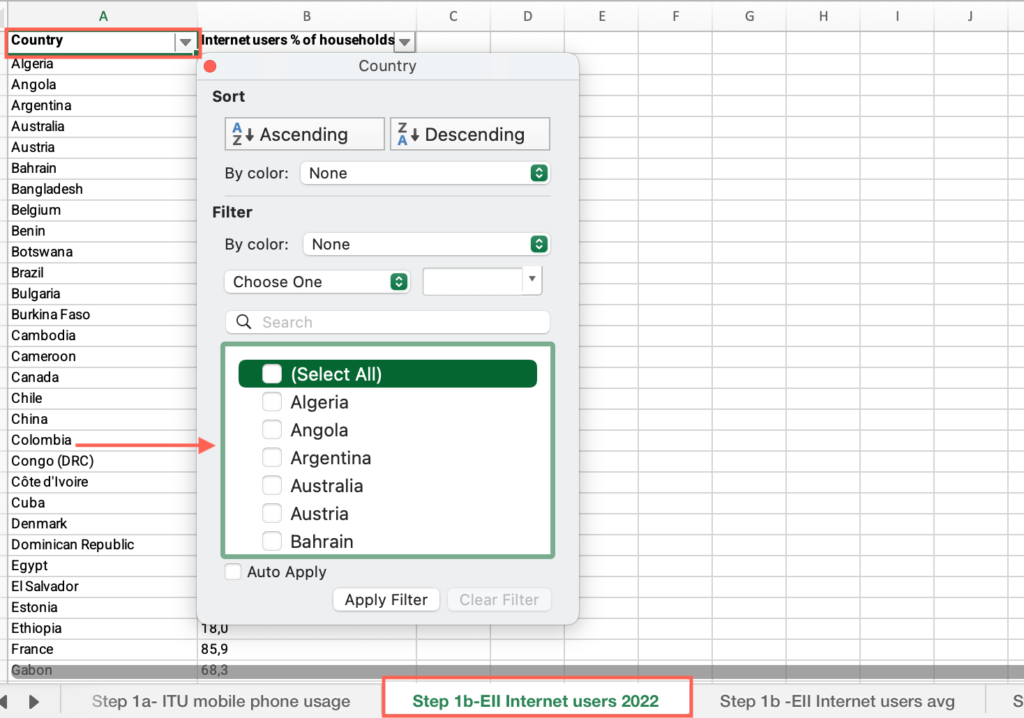
- Locate the “Internet users % of households” column > Find the value and answer the question on the platform.
Step 1b: What is the world average?
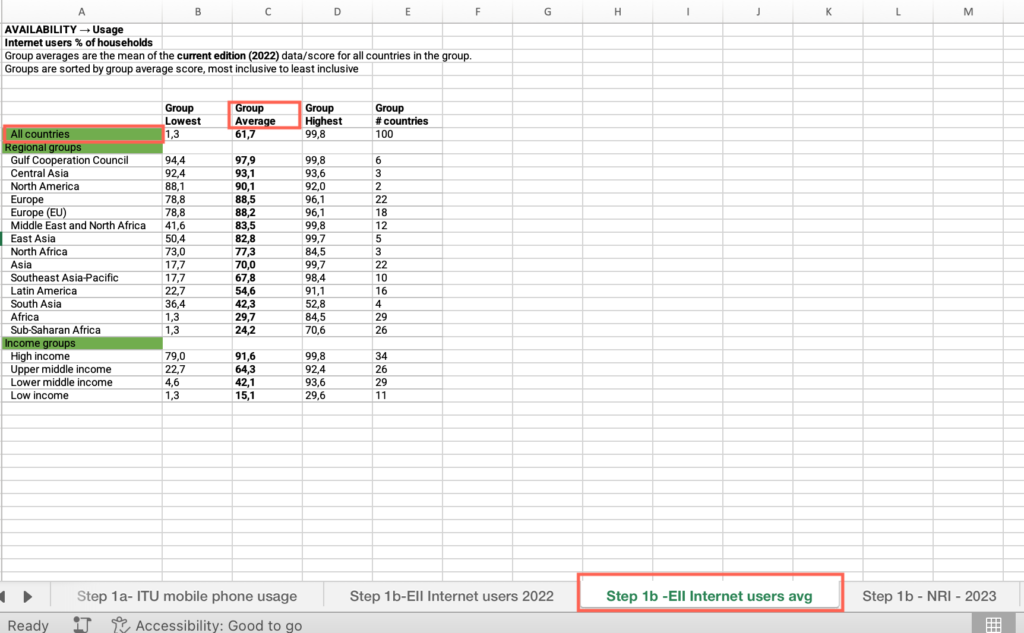
- Open the “Step 1b -EII Internet users avg” sheet > Locate the “All countries”cell > Locate the “Group average” column > Find the value and answer the question on the platform.
Step 1b: Is your country below the average for your income-group?
- Open the “Step 1b -EII Internet users avg” sheet > Locate the “Income groups”cell > Find your income group > Locate the “Group average” column > Find the value, compare it with your country’s score and answer the question on the platform.
Step 1b: Is your country below the regional average?
- In the “Step 1b -EII Internet users avg” sheet > Locate the “Regional groups”cell > Find your regional group > Locate the “Group average” column > Find the value, compare it with your country’s score and answer the question on the platform.
Step 1b: Is your country’s score below 65 in the Gender Gap in Internet Use indicator?
- Open the “Step 1b – NRI – 2023” sheet > Locate the “Country” column > Uncheck “Select All” > Check the box for your country.
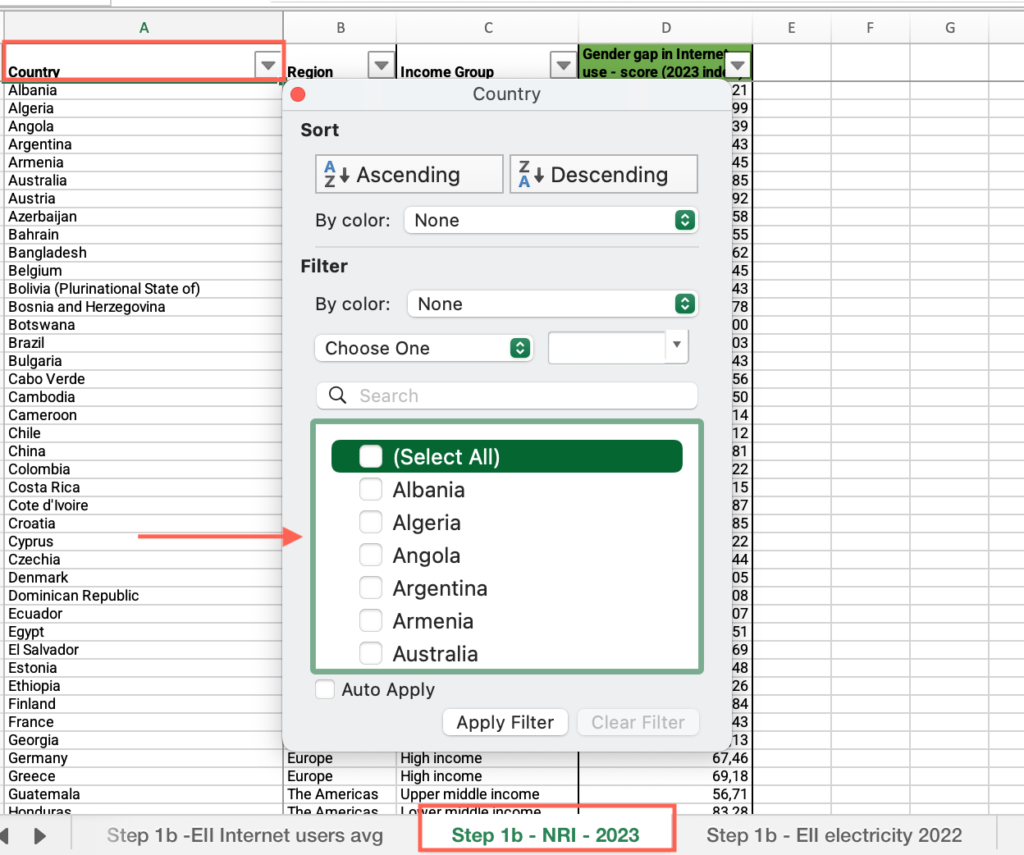
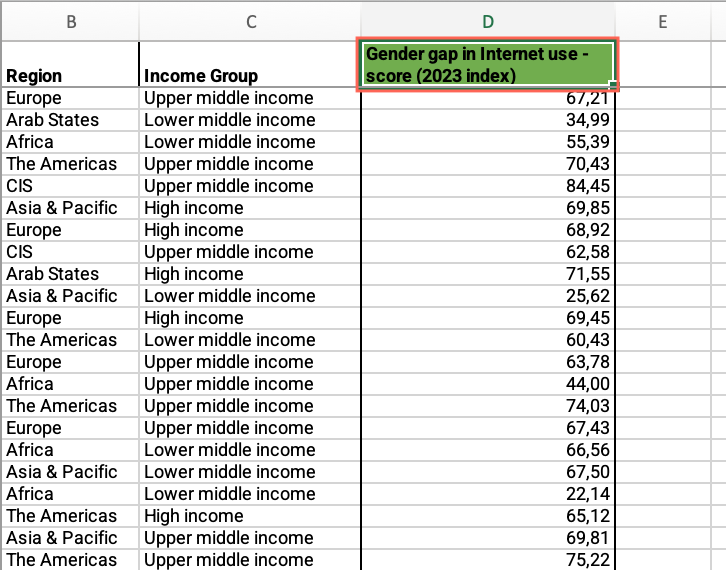
- Locate the “Gender gap in Internet use – score (2023 index)” column > Find the value and answer the question on the platform.
Step 1b: What is your country’s score of total electricity access?
- In the “Step 1b – EII electricity 2022” sheet, locate the “Country” column > Apply the filter > Check the box for your country.
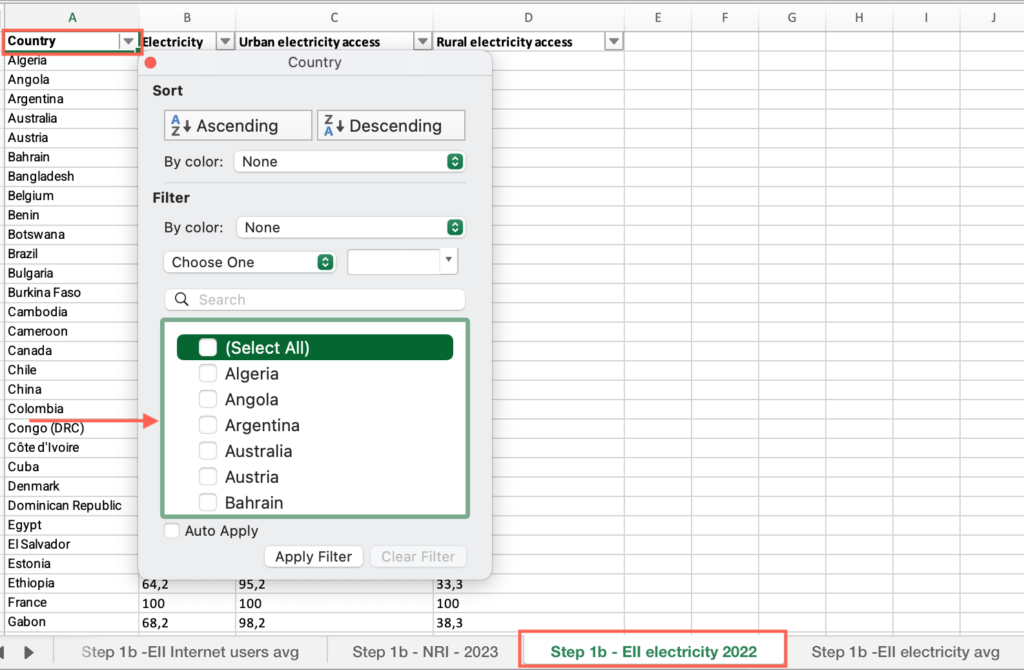
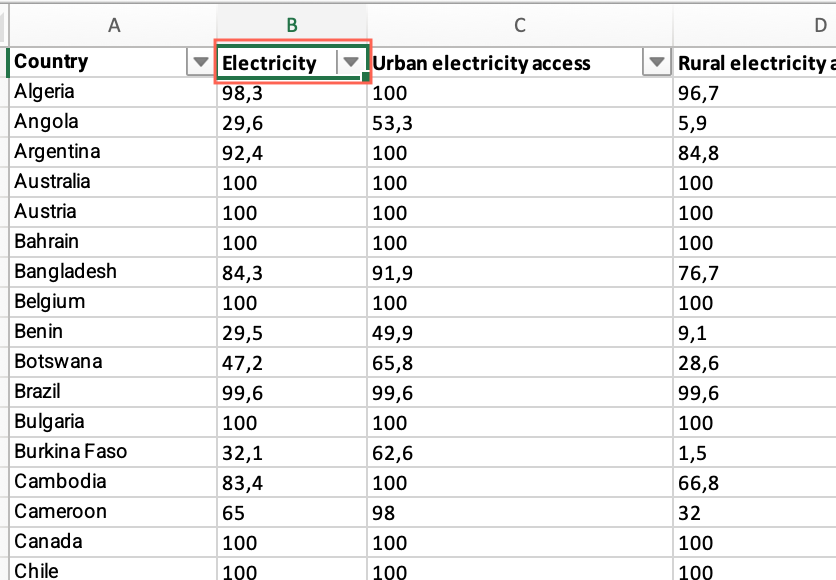
- Locate the “Electricity” column > Find the value and answer the question on the platform.
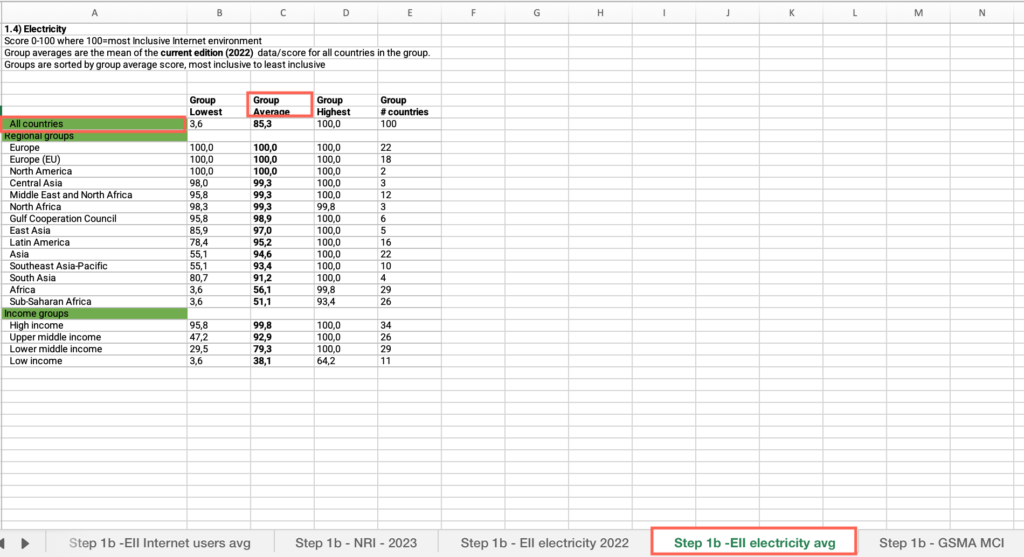
Step 1b: Is it below the world average?
- Open the “Step 1b -EII Electricity avg” sheet > Locate the “All countries”cell > Locate the “Group average” column > Find the value and answer the question on the platform.
Step 1b: Is your country’s rural score below 90 percent?
- In the “Step 1b – EII electricity 2022” sheet, locate the “Country” column > Apply the filter > Check the box for your country.
- Locate the “Rural electricity access” column > Find the value and answer the question on the platform.
Step 1b: Is there a significant difference (more than 10 percentage points) between the two scores indicating a location gap affecting rural population?
- In the “Step 1b – EII electricity 2022” sheet, locate the “Country” column > Apply the filter > Check the box for your country.
- Locate the “Urban electricity access” column > Find the value, compare it with the Rural electricity access value and answer the question on the platform.
Step 1b: What is your country score in the Network Performance dimension?
- Open the “Step 1b – GSMA MCI” sheet > Locate the “Country” column > Uncheck “Select All” > Check the box for your country.
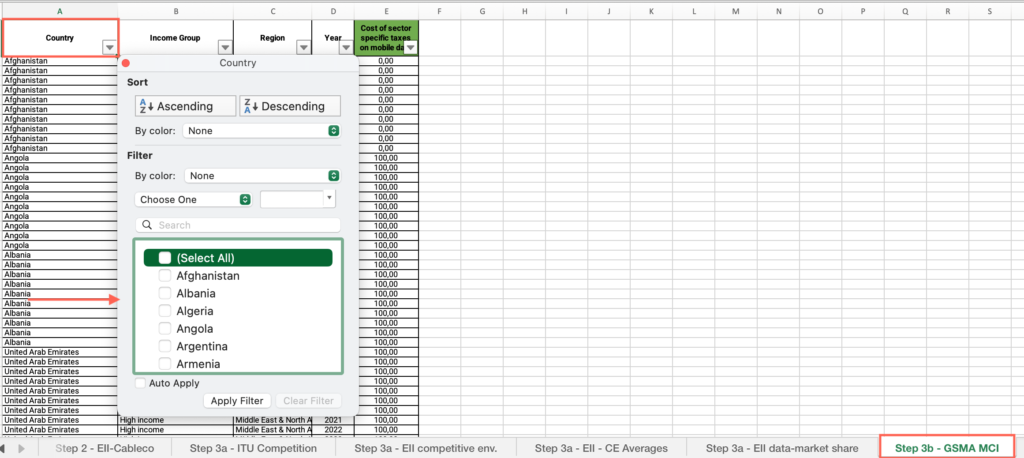
- Locate the “Year” column > Filter by the most recent year.
- Locate the “Network Performance” column > Find the value and answer the question on the platform.
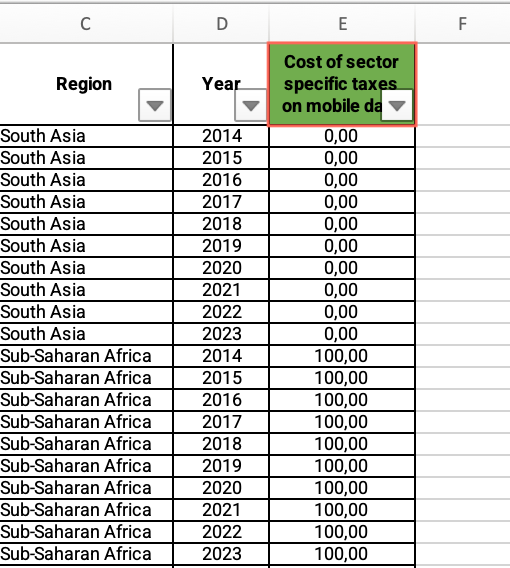
Step 1b: What is the average for all countries in the dataset?
- In the “Step 1b – GSMA MCI” sheet, locate the “Country” column > Apply the filter > Check “Select all.”
- Locate the “Network performance” column > Click and drag to select the entire range of cells in this column > Find the average at the bottom of the sheet and answer the question on the platform.
Step 1b: What is the average for all countries in your income group?
- In the “Step 1b – GSMA MCI” sheet, locate the “Income group” column > Filter by your income group.
- Locate the “Network performance” column > Click and drag to select the entire range of cells in this column > Find the average at the bottom of the sheet and answer the question on the platform.
Step 1b: What is the average for countries in the same geographic region as your country?
- In the “Step 1b – GSMA MCI” sheet, locate the “Region” column > Filter by your region.
- Locate the “Network performance” column > Click and drag to select the entire range of cells in this column > Find the average at the bottom of the sheet and answer the question on the platform.
Step 1c: What is the number of ATMs per 100,000 adults in your country?
- Open the “Step 1c – IMF FAS” sheet > Locate the “Country” column > Uncheck “Select All” > Check the box for your country.
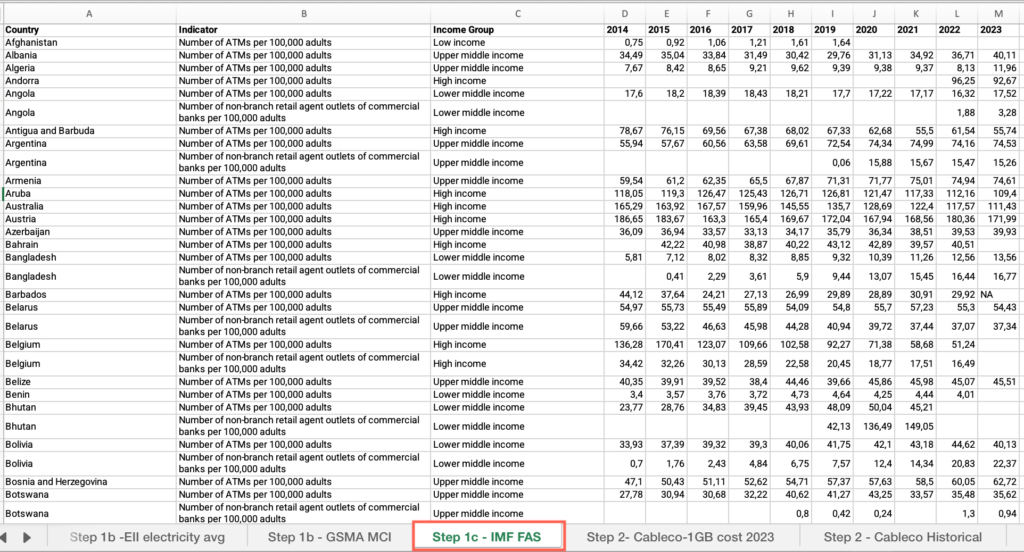
- Locate the “Indicator” column > Filter by “number of ATMs per 100,000 adults”.
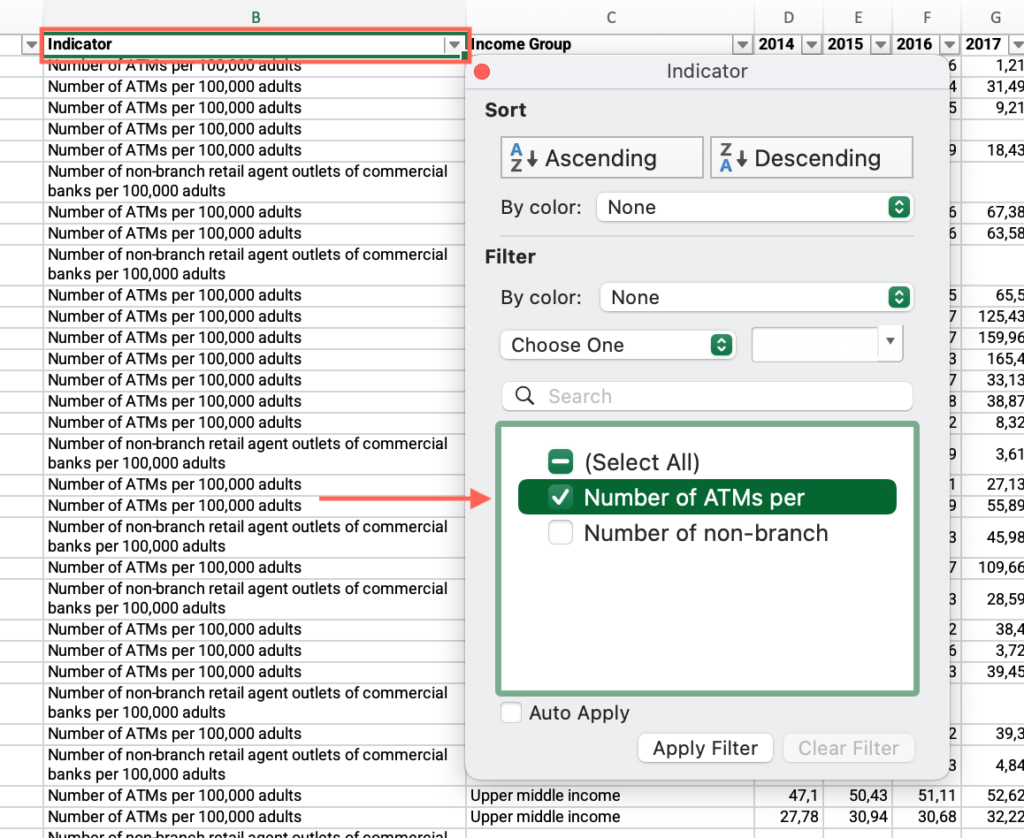
- Move across columns to find the most recent year with available data > Find the value and answer the question on the `platform.

Step 1c: Is the number of ATMs per 100,000 adults below the world average?
- In the “Step 1c – IMF FAS” sheet, locate the “Country” column > Apply the filter > Check “Select all.”
- Locate the “Indicator” column > Filter by “number of ATMs per 100,000 adults”.
- Move across columns to find the most recent year with available data for your country > Apply the Filter > Uncheck “Blanks”
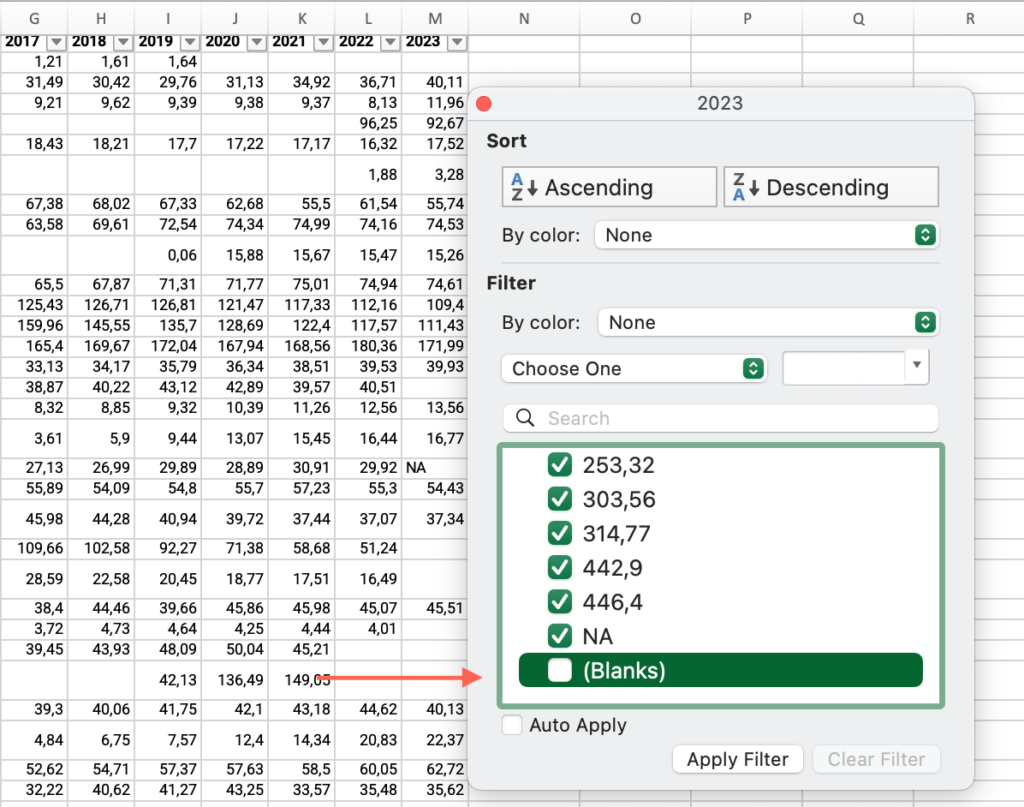
- Click and drag to select the entire range of cells in this column > Find the average at the bottom of the sheet, compare it with your country’s value and answer the question on the platform.
Step 1c: Is the number of ATMs per 100,000 adults below the average for your country’s income group?
- In the “Step 1c – IMF FAS” sheet, locate the “Income group” column > Filter by your income group.
- Locate the “Indicator” column > Filter by “number of ATMs per 100,000 adults”.
- Move across columns to find the most recent year with available data for your country > Apply the Filter > Uncheck “Blanks”.
- Click and drag to select the entire range of cells in this column > Find the average at the bottom of the sheet, compare it with your country’s value and answer the question on the platform.
Step 1c: What is the number of non-branch retail agent outlets of commercial banks per 100,000 adults?
- Open the “Step 1c – IMF FAS” sheet > Locate the “Country” column > Uncheck “Select All” > Check the box for your country.
- Locate the “Indicator” column > Filter by “non-branch retail agent outlets of commercial banks”.
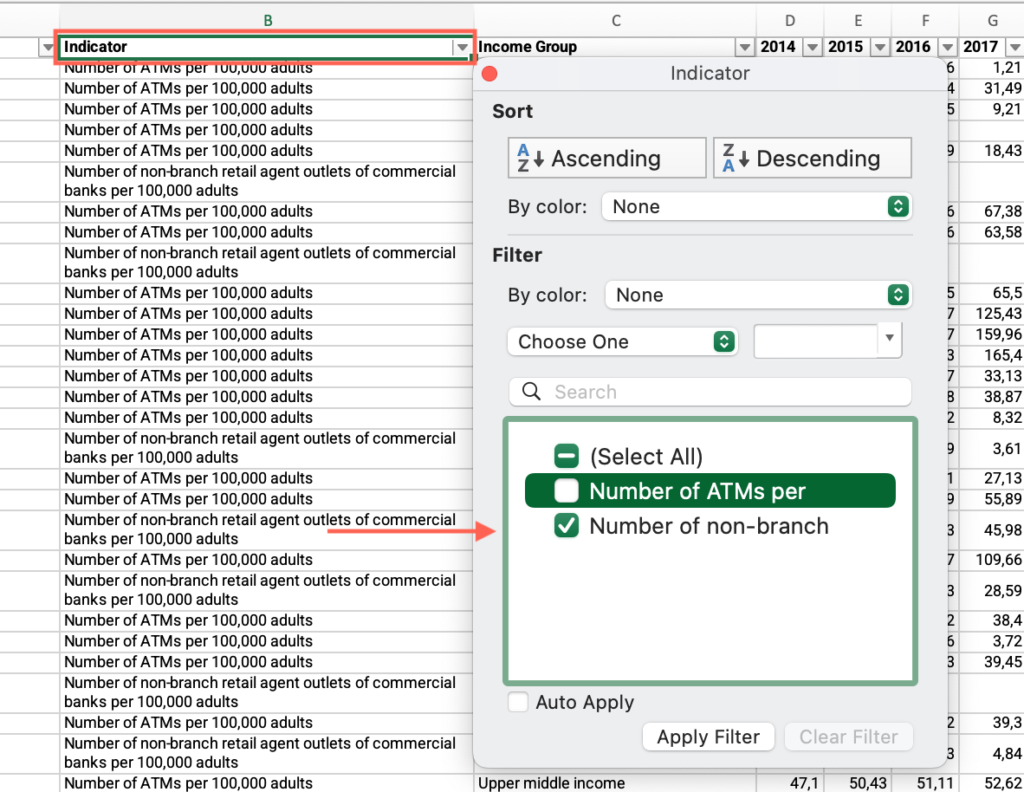
- Move across columns to find the most recent year with available data > Find the value and answer the question on the `platform.
Step 1c: Is the number of non-branch retail agent outlets of commercial banks per 100,000 adults below the world average?
- In the “Step 1c – IMF FAS” sheet, locate the “Country” column > Apply the filter > Check “Select all.”
- Locate the “Indicator” column > Filter by “number of non-branch retail agent outlets of commercial banks per 100,000 adults”.
- Move across columns to find the most recent year with available data for your country > Apply the Filter > Uncheck “Blanks”.
- Click and drag to select the entire range of cells in this column > Find the average at the bottom of the sheet, compare it with your country’s value and answer the question on the platform.
Step 1c: Is the number of non-branch retail agent outlets of commercial banks per 100,000 adults below the average for your country’s income group?
- In the “Step 1c – IMF FAS” sheet, locate the “Income group” column > Filter by your income group.
- Locate the “Indicator” column > Filter by “non-branch retail agent outlets of commercial banks per 100,000 adults”.
- Move across columns to find the most recent year with available data for your country > Apply the Filter > Uncheck “Blanks”.
- Click and drag to select the entire range of cells in this column > Find the average at the bottom of the sheet, compare it with your country’s value and answer the question on the platform.
Step 2: What is your country’s average price of 1GB of mobile data in US dollars?
- Open the “Step 2- Cableco-1GB cost 2023” sheet > Locate the “Country” column > Uncheck “Select All” > Check the box for your country.
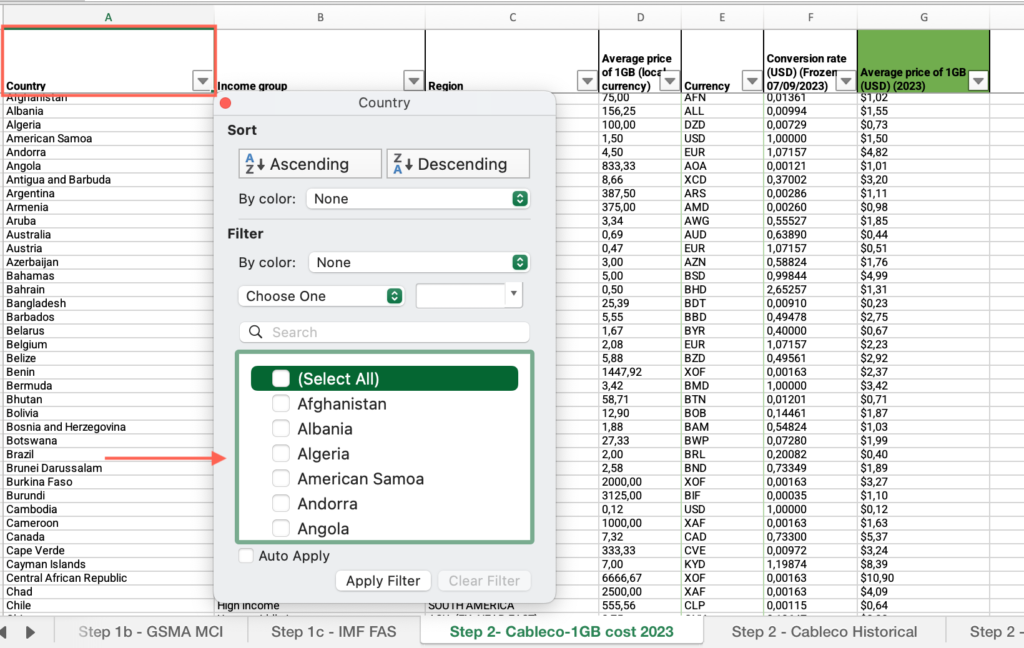
- Locate the “Average price of 1GB (USD) (2023)” column > Find the value and answer the question on the platform.
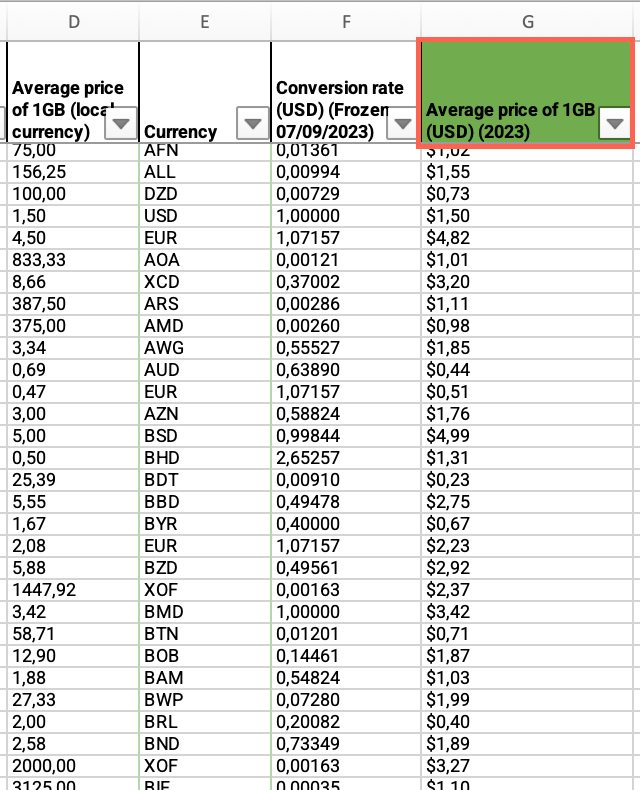
Step 2: What is the world’s average price of 1GB of mobile data in US dollars?
- In the “Step 2- Cableco-1GB cost 2023” sheet, locate the “Country” column > Apply the filter > Check “Select all.”
- Locate the “Average price of 1GB (USD) (2023)” column > Click and drag to select the entire range of cells in this column > Find the average at the bottom of the sheet and answer the question on the platform.
Step 2: Have prices decreased or increased over time?
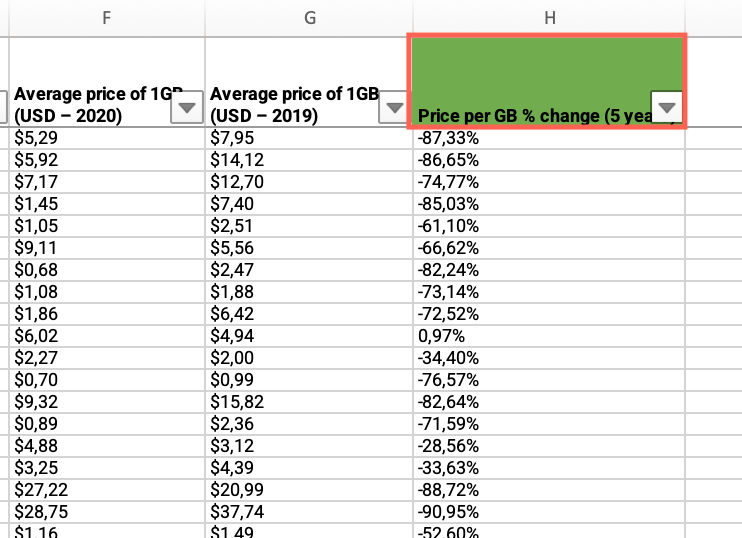
- In the “Step 2 – Cableco Historical” sheet, locate the “Country” column > Filter by your country.
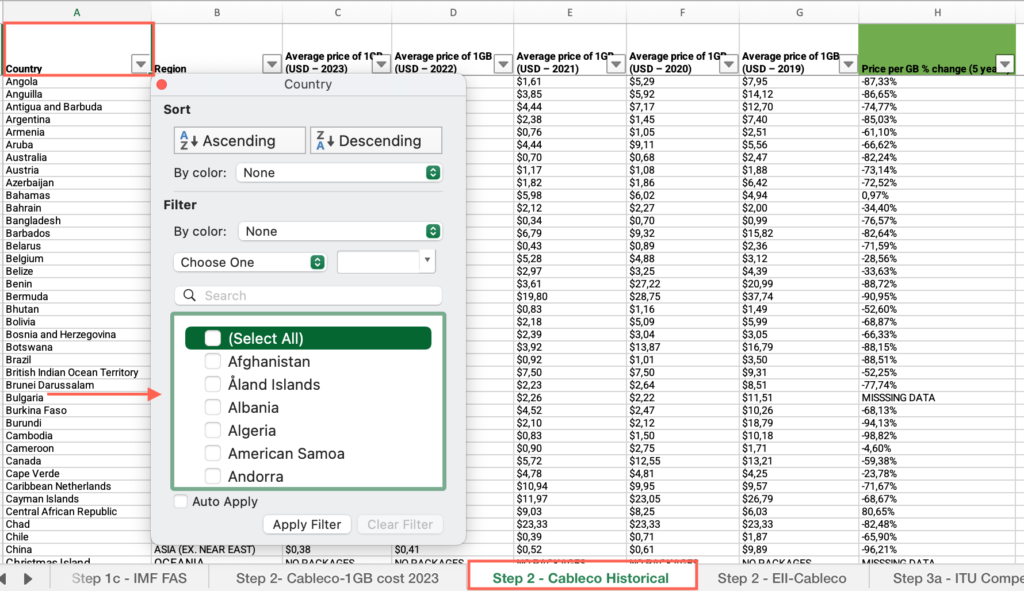
- Locate the “Price per GB % change (5 years)” column > Find the value and answer the question on the platform.
Step 2: Usage of mobile phones/price of mobile data graph
- Open the “Step 2 – EII Cableco” sheet.
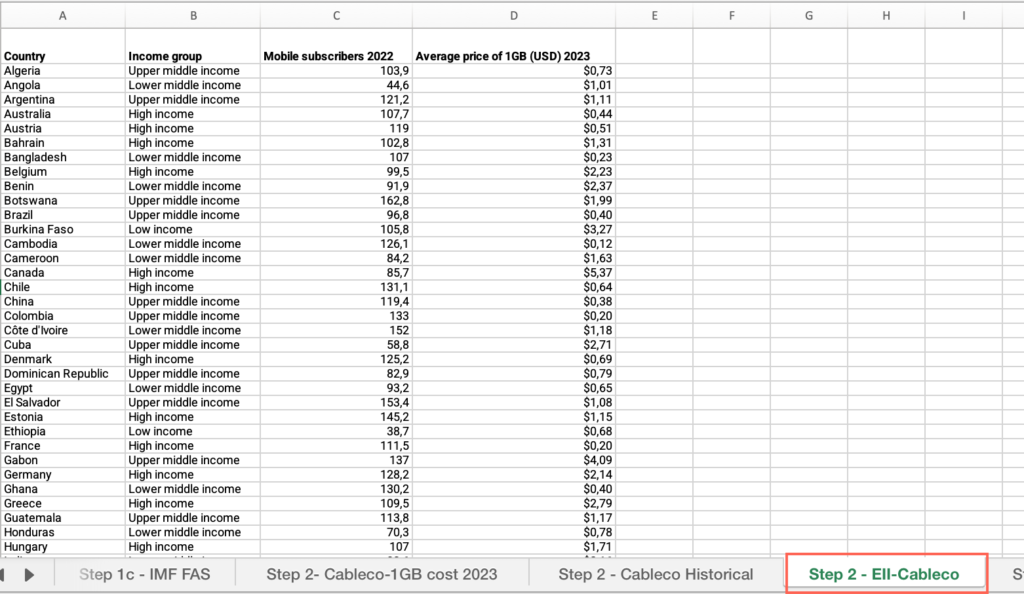
- Locate the “Income group” column > Apply the filter > Uncheck “High-income”.
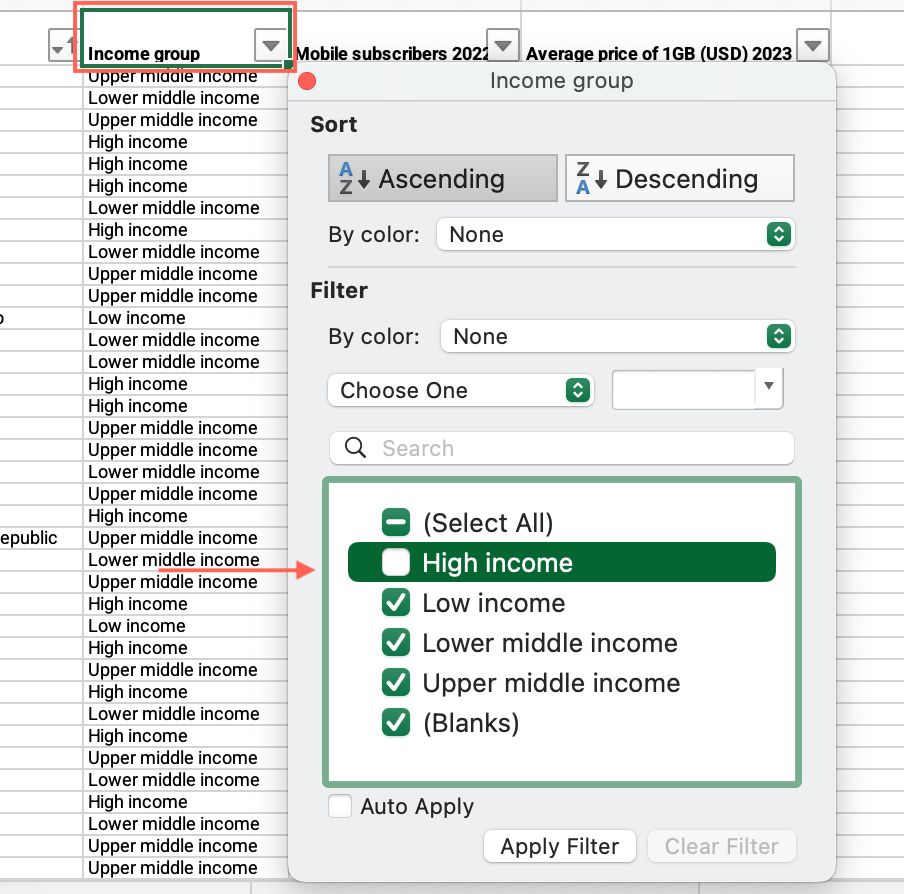
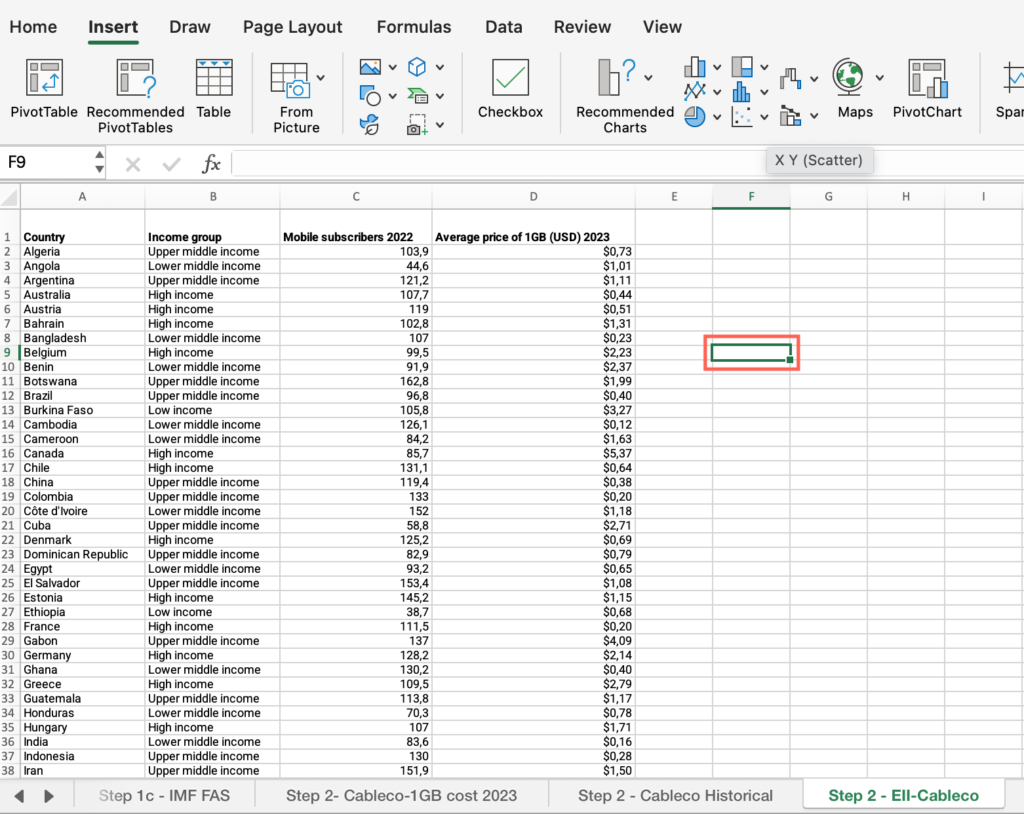
- Locate an empty cell outside the data range, not associated with any row or column containing data > Click on the empty cell.
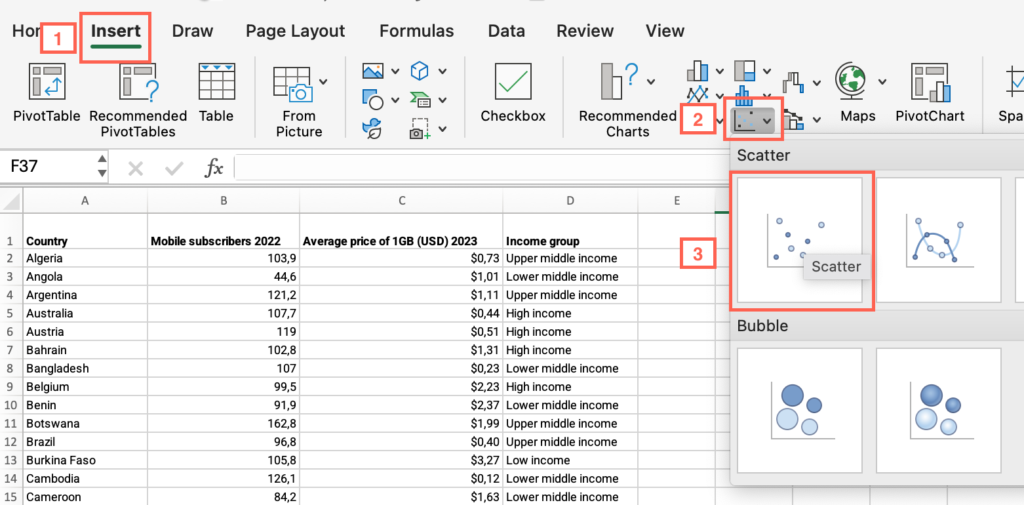
- Click the Insert menu > Locate the charts icons > click the Scatter plot icon > select “Scatter.”
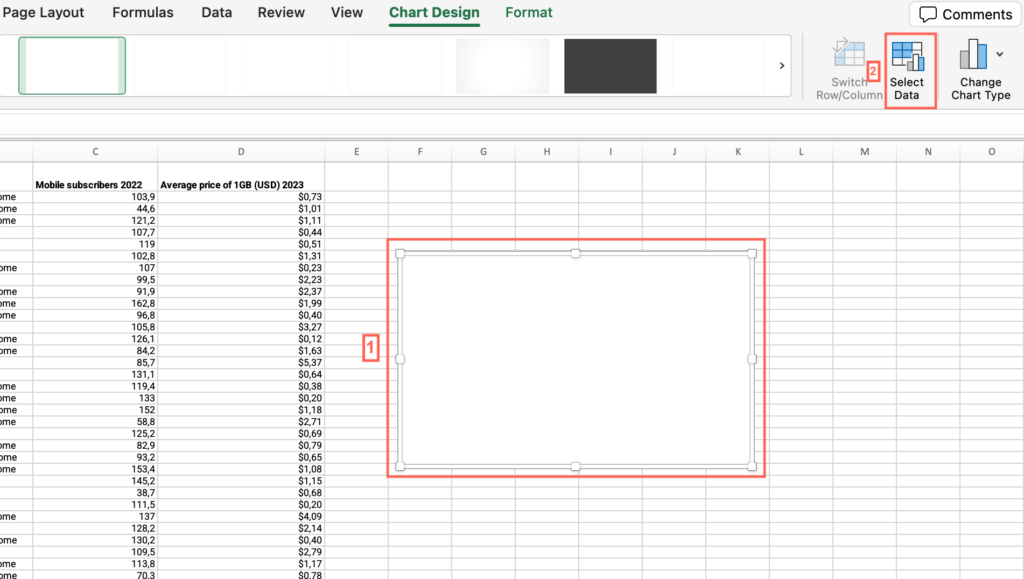
- Click on the chart area > Click the Chart Design menu > click “Select data.”
- Make sure the “Show data in hidden rows and columns” checkbox from the “Hidden and Empty Cells” options is unmarked.
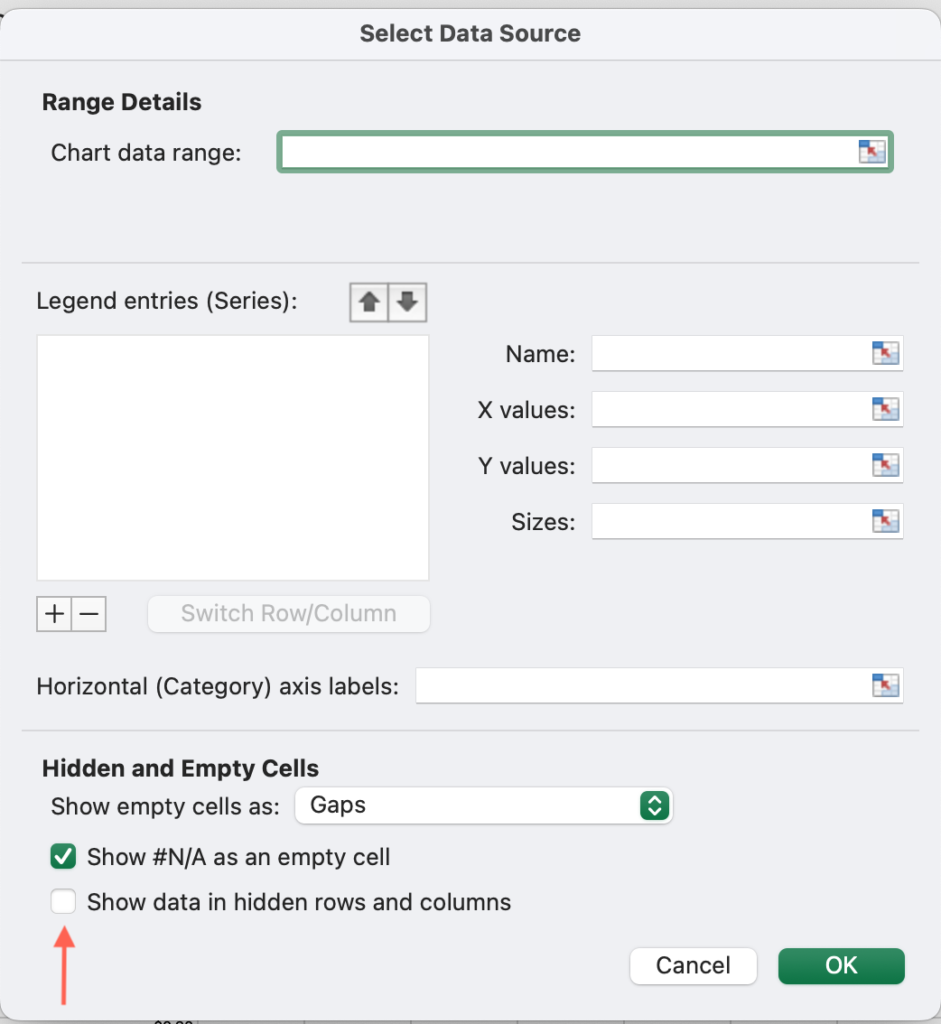
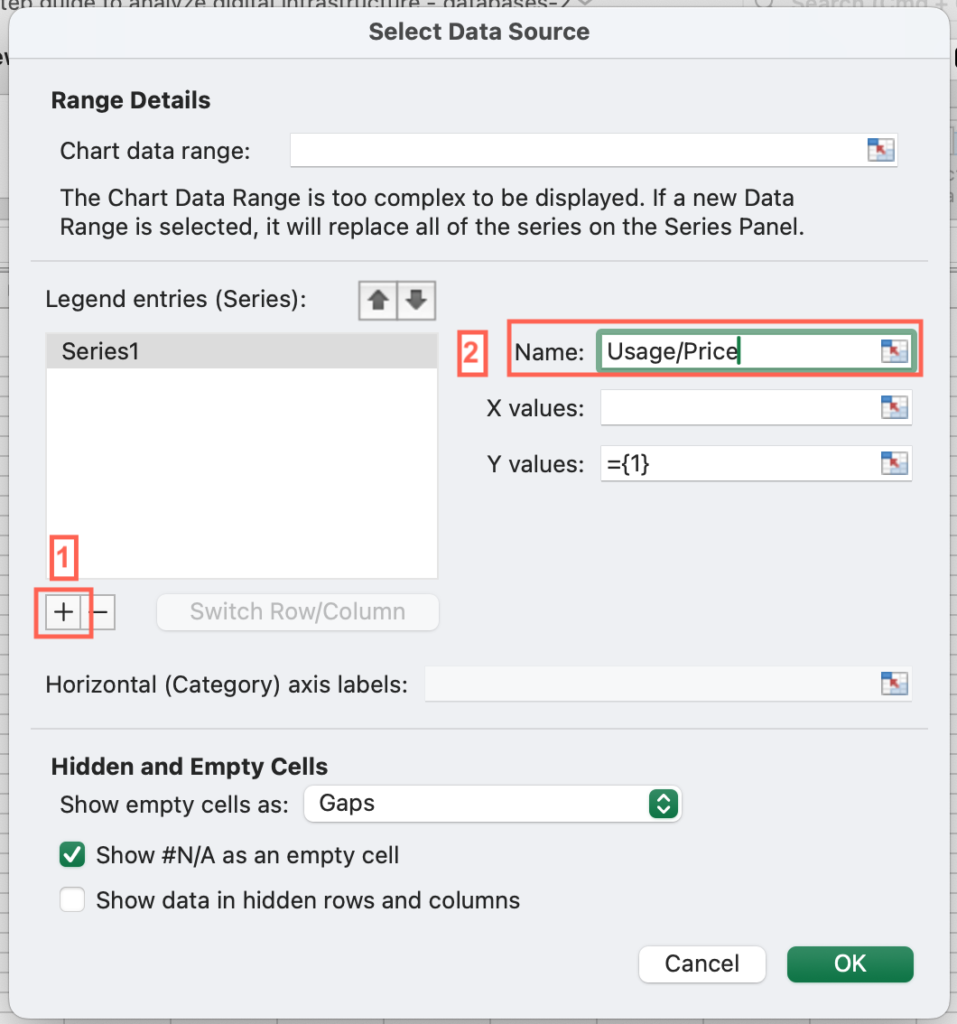
- Click on the + sign to add a series > In the “Name” field, type “Usage/Prices.”
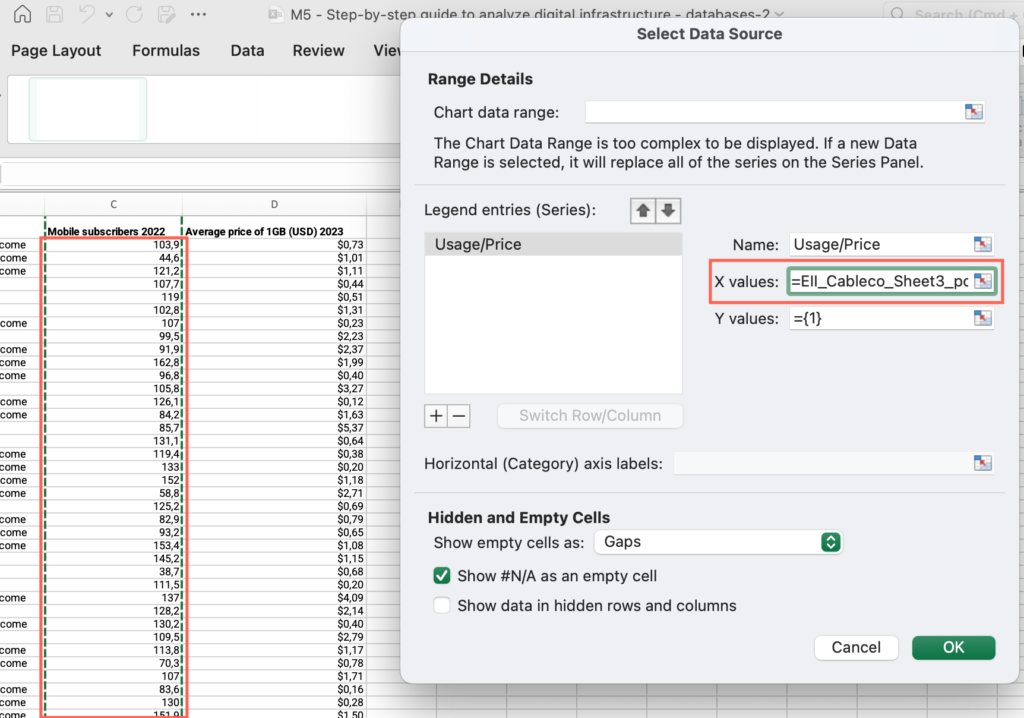
- Click the “X Values” field > Select all cells with values for the “mobile subscribers per 100 inhabitants” indicator.
- Click the “Y Values” field > Select all cells with values for the “price of 1GB of mobile data” indicator.
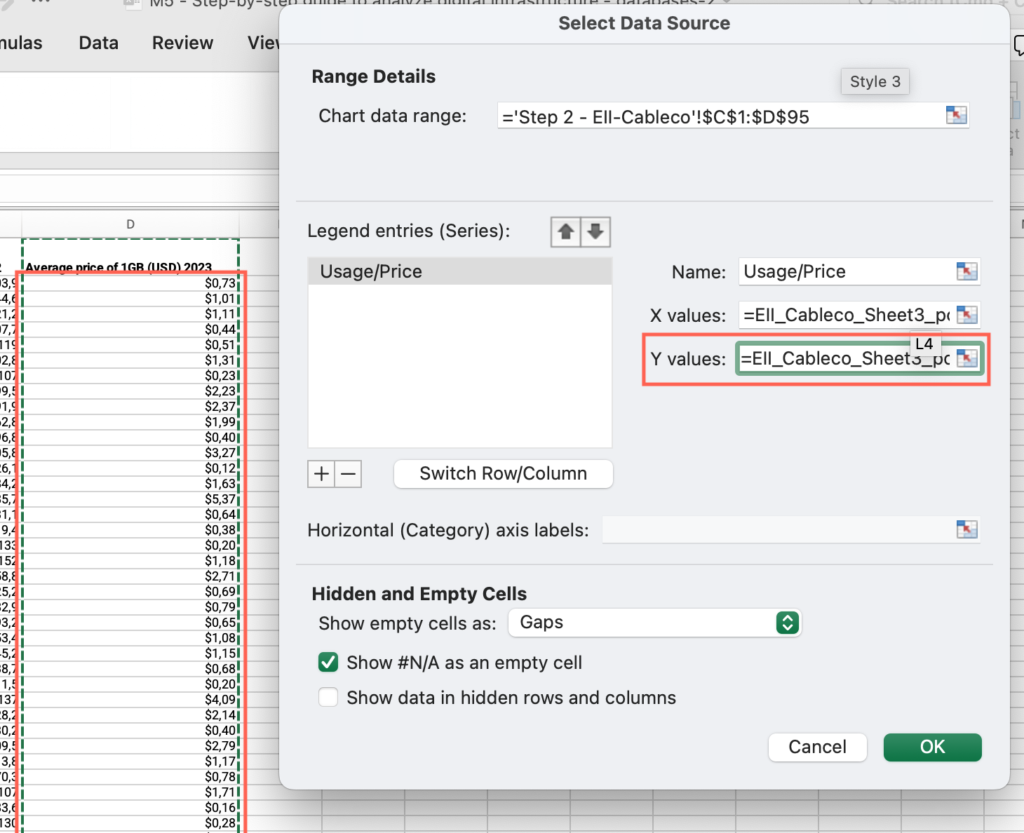
- Press “OK.”
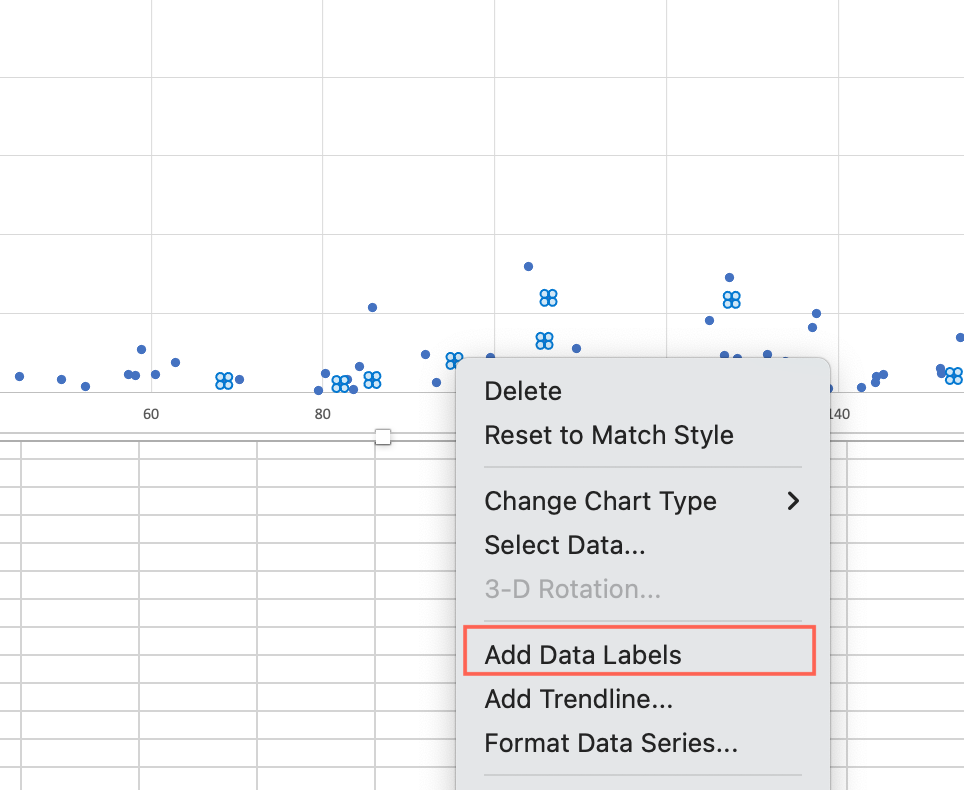
- Right click on one of the data points > select “Add data label.”
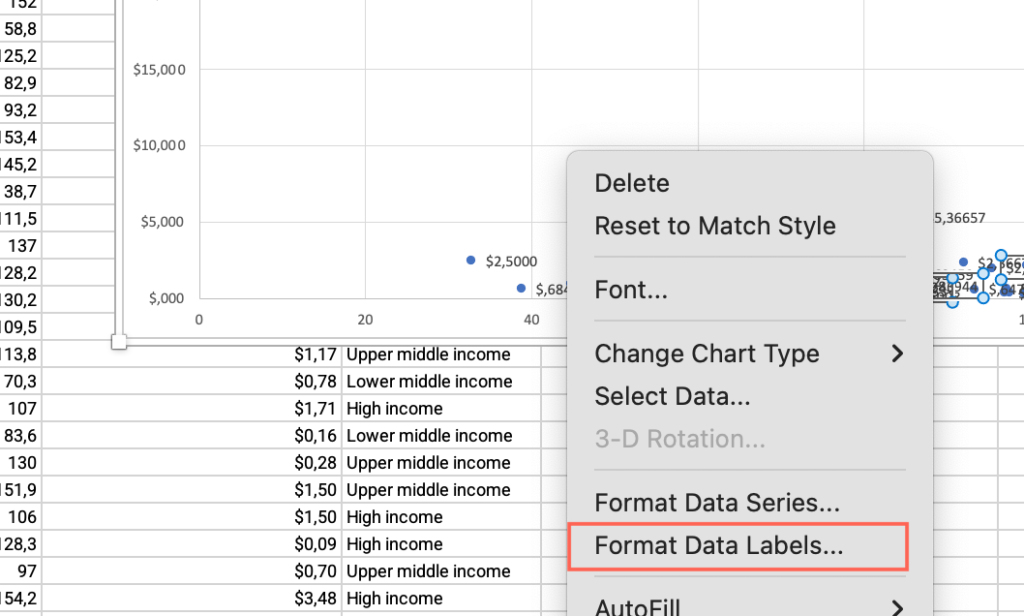
- Right click on one of the data points > select “Format data label.”
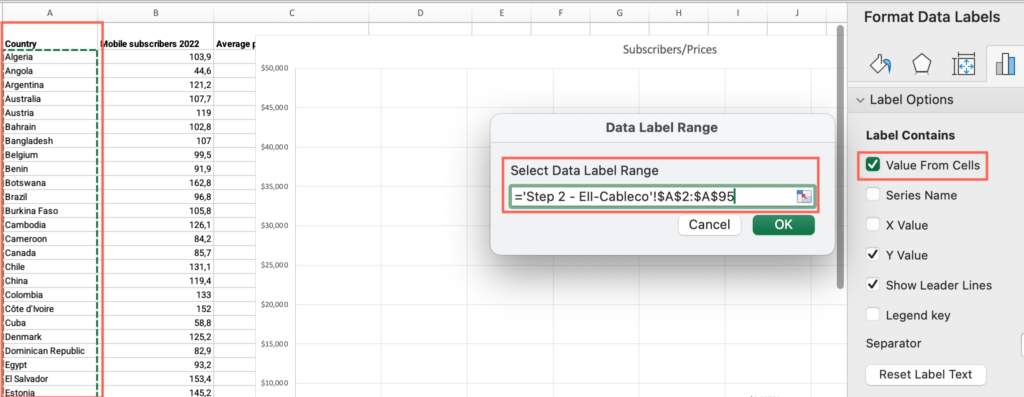
- Under “Label contains” check “Value from cells” > Select all cells with values under the “Country” column > Press OK.
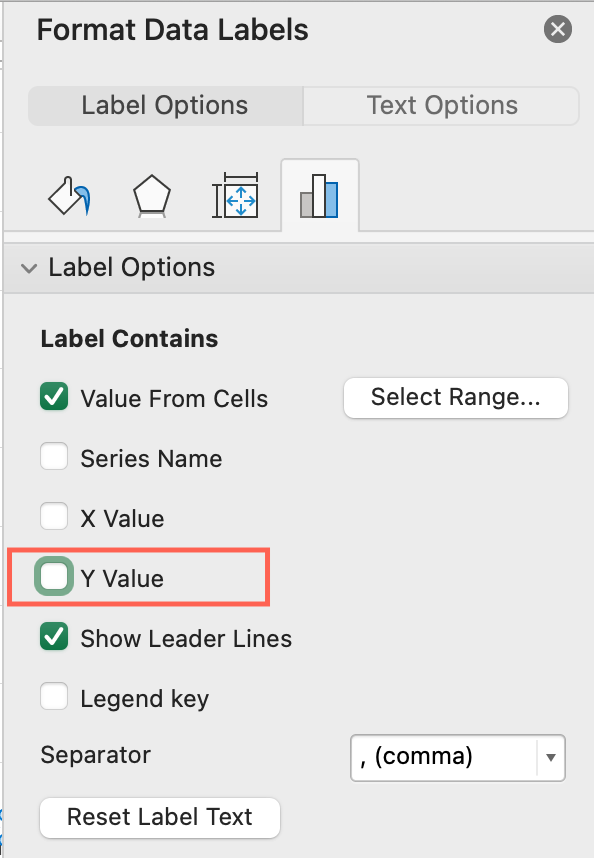
- Uncheck “Y value.”
- Analyze the output and answer the question on the platform.
Step 3a: Is there full competition, partial competition, or monopoly in ICT services?
- Open the “Step 3a – ITU Competition” sheet > Locate the “Country” column > Uncheck “Select All” > Check the box for your country.
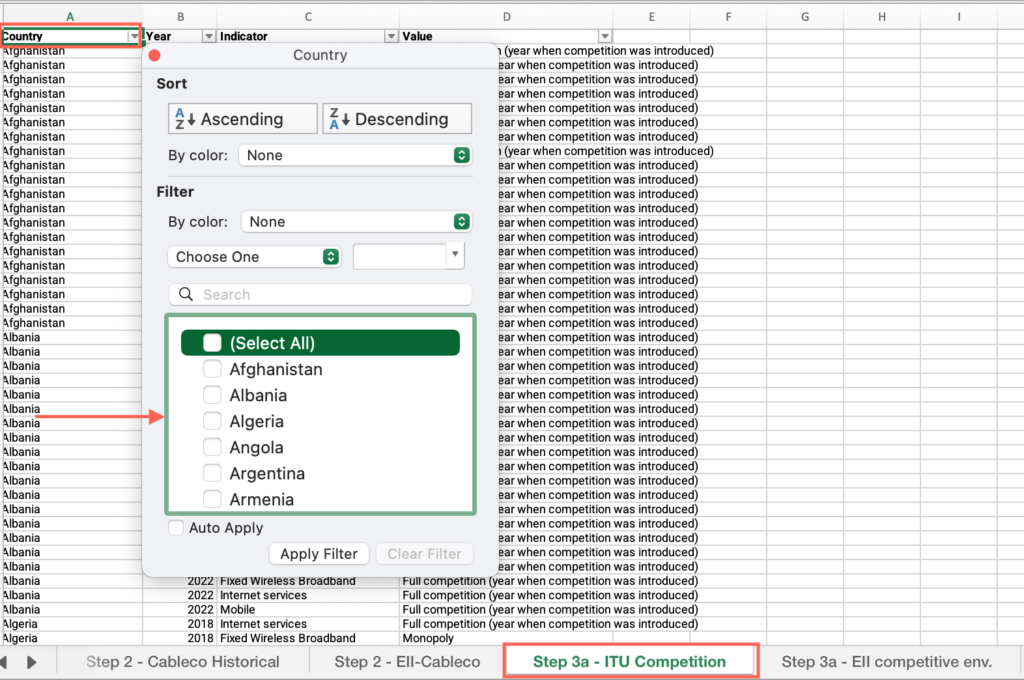
- Locate the “Year” column > Filter by the most recent year.
- Locate the “Indicator” column > Filter by “Internet services” > Find the value and answer the question on the platform.
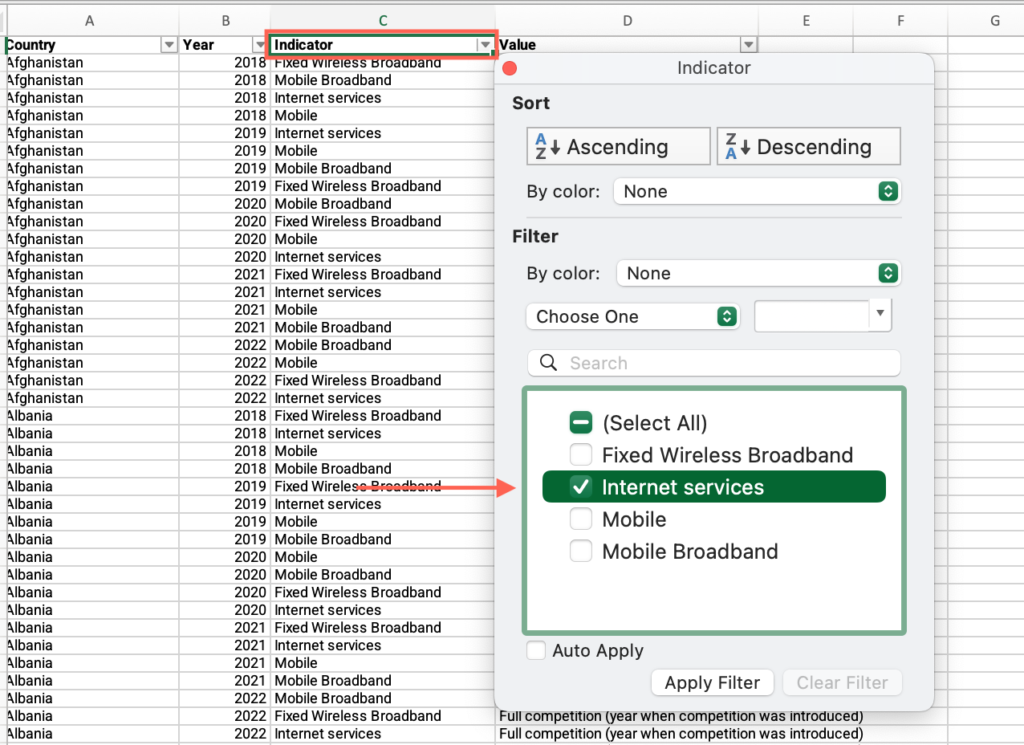
- Repeat these steps for the remaining 3 indicators.
Step 3a: What is your country’s overall score in the competitive environment indicator?
- Open the “Step 3a – EII competitive env.” sheet, locate the “Country” column > Apply the filter > Check the box for your country.
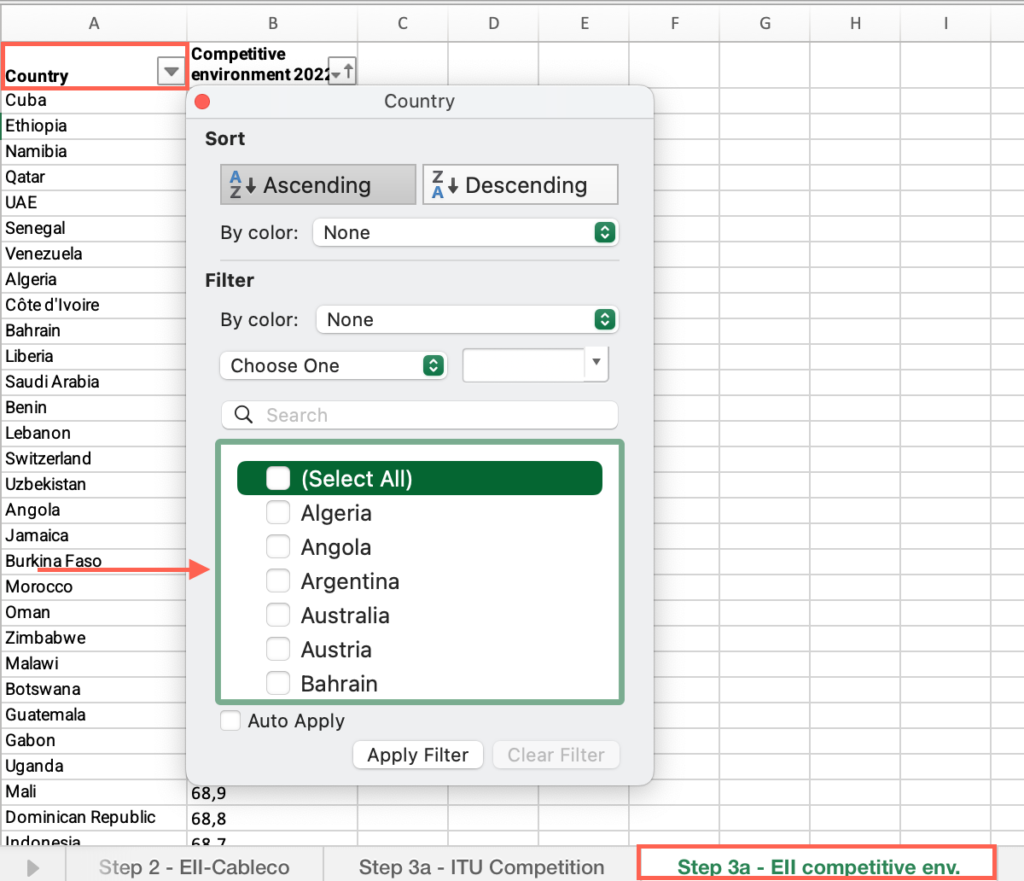
- Locate the “Competitive environment 2022” column > Find the value and answer the question on the platform.
Step 3a: Is your country’s score in the bottom half of countries in the sample?
- In the “Step 3a – EII competitive env.” sheet, locate the “Competitive environment 2022” column > Click and drag to select the range of cells in the column. Make sure to include the header row.
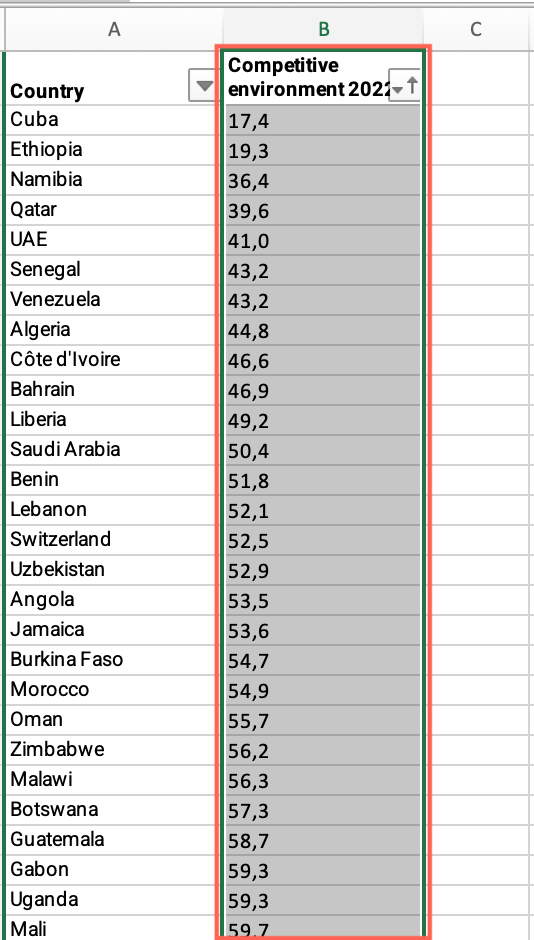
- Click the Data tab > Locate the Sort group > Click “Sort”.
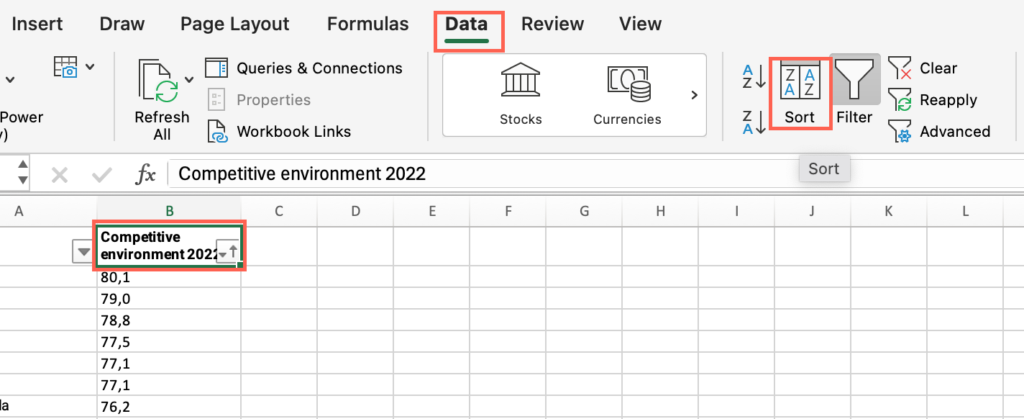
- In the Sort by menu, select: “Competitive environment 2022” for the column, “Values” for Sort on, and “Largest to smallest” for the order.
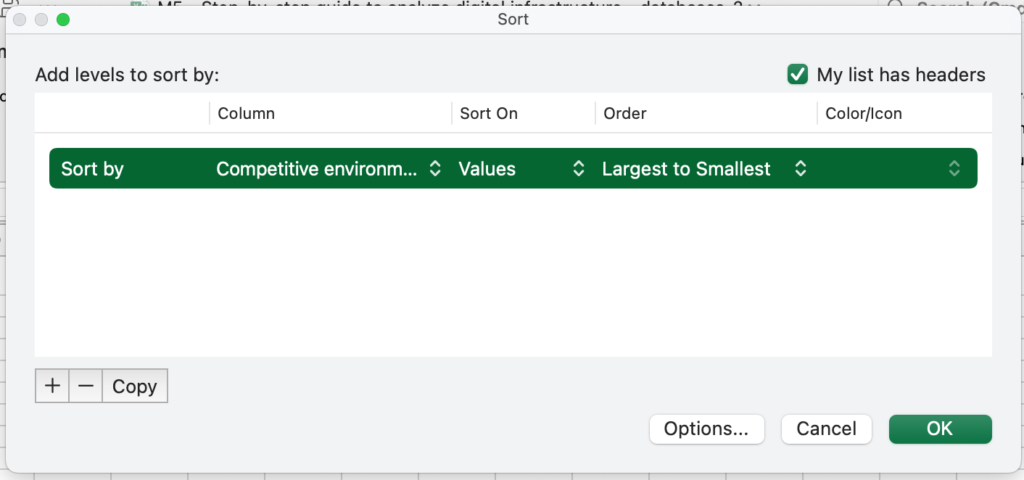
- Analyze the output and answer the question on the platform.
Step 3a: Is your country below the average for your income-group?
- Open the “Step 3a – EII – CE Averages” sheet > Locate the “Income groups”cell > Locate the “Group average” column > Find the value and answer the question on the platform.
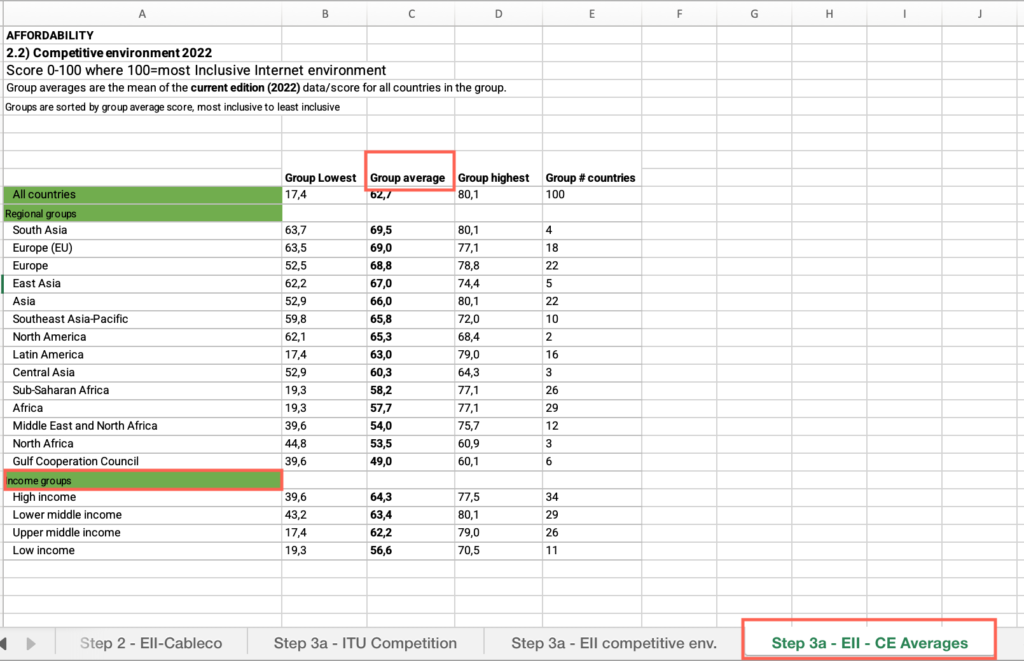
Step 3a: Does your country have an HHI score >4,000 in the wireless operators’ market share?
- Open the “Step 3a – EII data-market share” sheet, locate the “Country” column > Apply the filter > Check the box for your country.
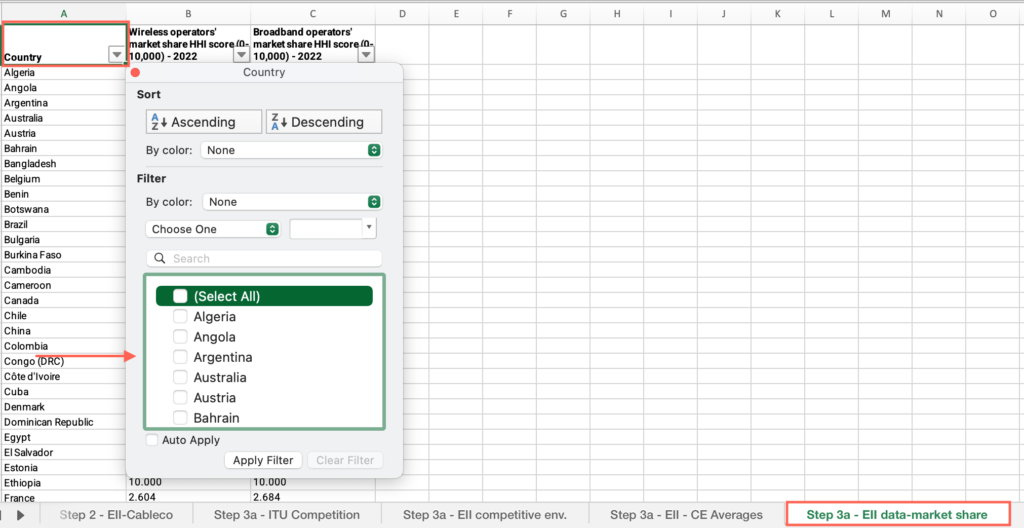
- Locate the “Wireless operators’ market share HHI score (0-10,000) – 2022” column > Find the value and answer the question on the platform.
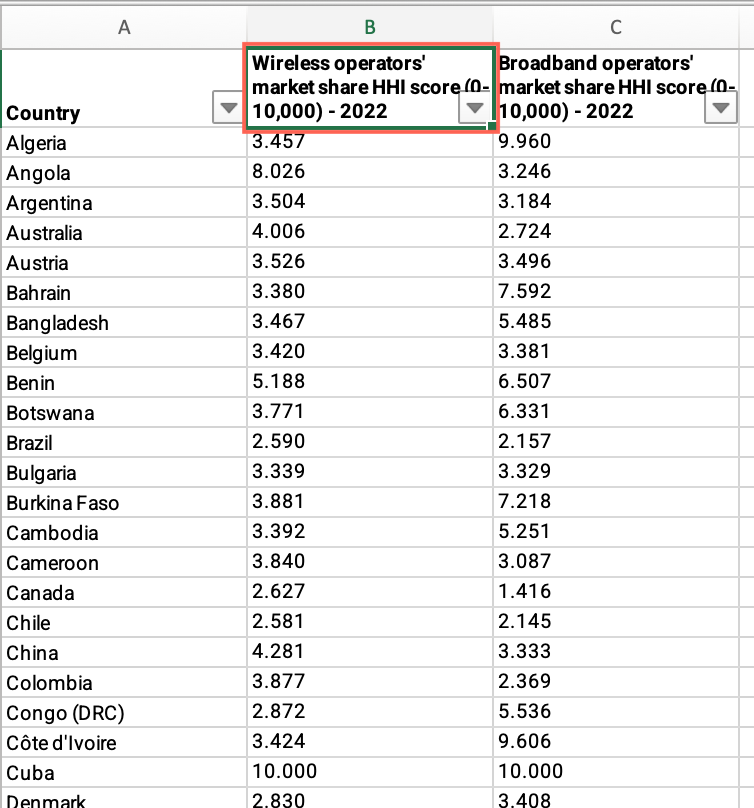
Step 3a: Does your country have an HHI score >4,000 in the broadband operators’ market share?
- Open the “Step 3a – EII data-market share” sheet, locate the “Country” column > Apply the filter > Check the box for your country.
- Locate the “Broadband operators’ market share HHI score (0-10,000) – 2022” column > Find the value and answer the question on the platform.
Step 3b: Does your country score 50 or above in the cost of sector specific taxes on mobile data indicator?
- Open the “Step 3b – GSMA MCI” sheet, locate the “Country” column > Apply the filter > Check the box for your country.
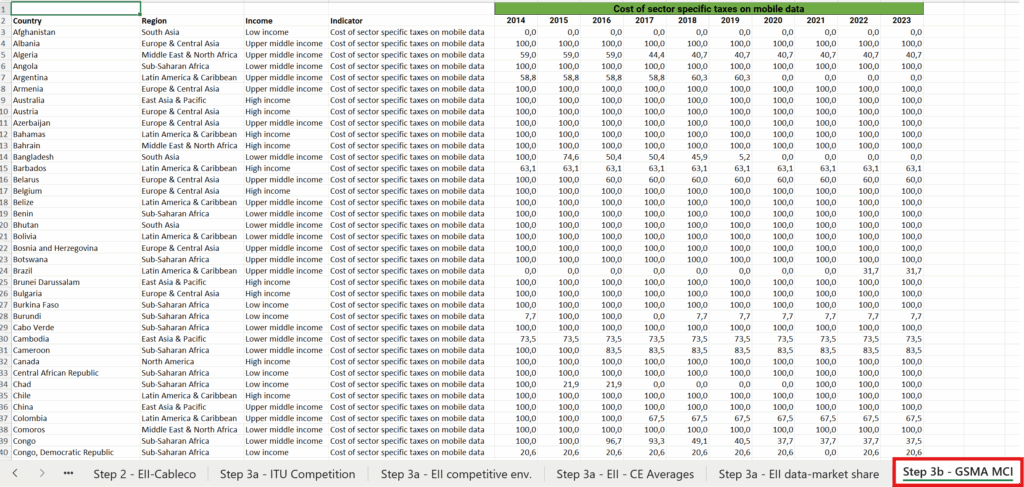
- In your country’s row, find the most recent score. To do this, scan the year columns from right to left and find the first number.
- If this score is 50 or higher, the answer is Yes. If it is lower than 50, the answer is No.
Step 3b: How does your country compare with the world average?
- First, find your country’s most recent score as explained in the previous tutorial. Note this number.
- Now, clear the filter on the “Country Name” column to see all the data again.
- Click on the column header for the most recent year (e.g., 2023) to select all the data in that column.
- Look at the status bar at the bottom of the Excel window to find the Average value for all countries (the world average).
- Compare your country’s score to this world average to answer the question.
Step 3b: How does your country perform when compared with countries of the same income group?
- In the “Step 3b – GSMA MCI” sheet, locate the “Income group” column > Filter by your income group.
- Once the data is filtered, click on the column header for the most recent year (e.g., 2023) to select all the visible scores for that group.
- Look at the status bar at the bottom to find the new Average for that specific income group.
- Compare your country’s score to this income group average to answer the question.
