Module 8 Assignment – Excel Tutorials
The following tutorial is an optional resource meant to assist you in navigating the databases and collecting the necessary data for your analysis.
Note on recording your responses: In the assignment you will find all the necessary fields to record your answers and the data you collect. You will also find an optional Answer Sheet Excel file to keep record of the collected data and your findings. You will find this file in the assignment’s introduction.
Step 1: Are deposit-taking institutions required to offer basic financial products in your country?
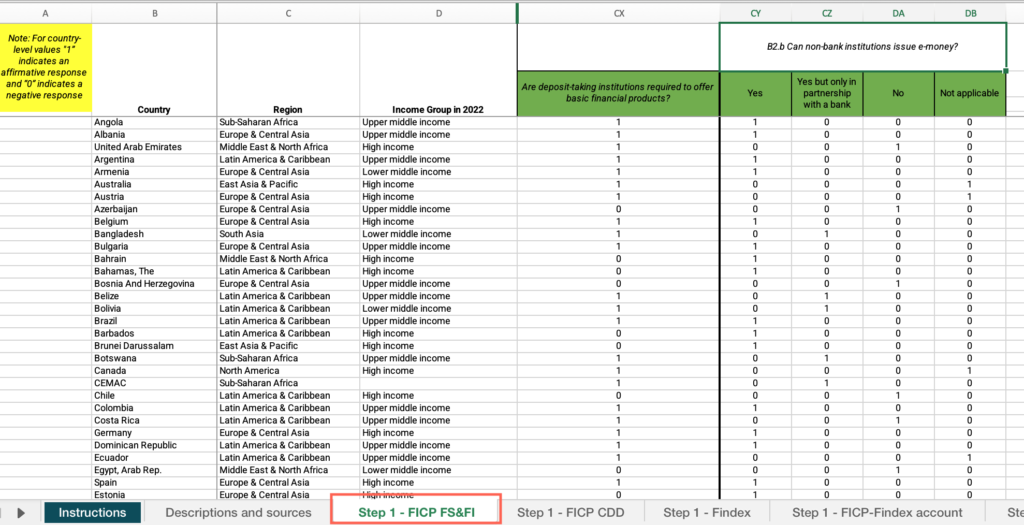
- In the M8 – Step-by-step guide to analyze problems identifying customers-databases Excel file, open the “Step 1– FICP-FS&FI” sheet.
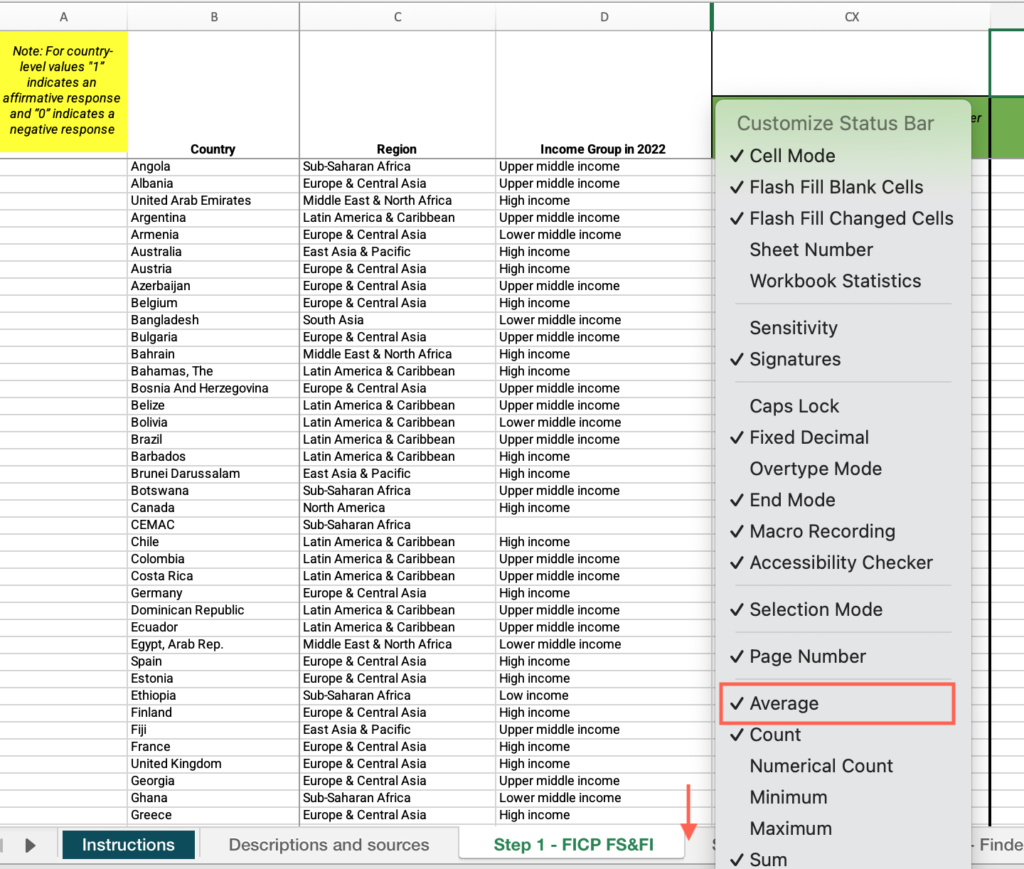
- Right-click on the status bar at the bottom of the Excel window > In the dialog box that appears, ensure that the checkbox for “Average” is checked.
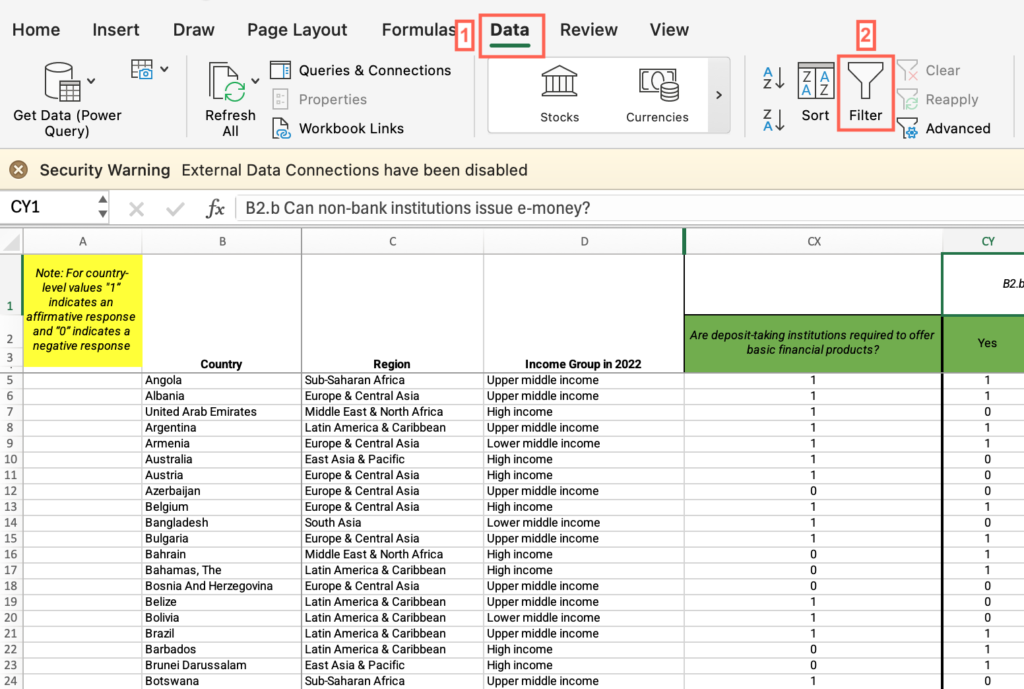
- Select the header row > click the Data menu > Select “Filter.”
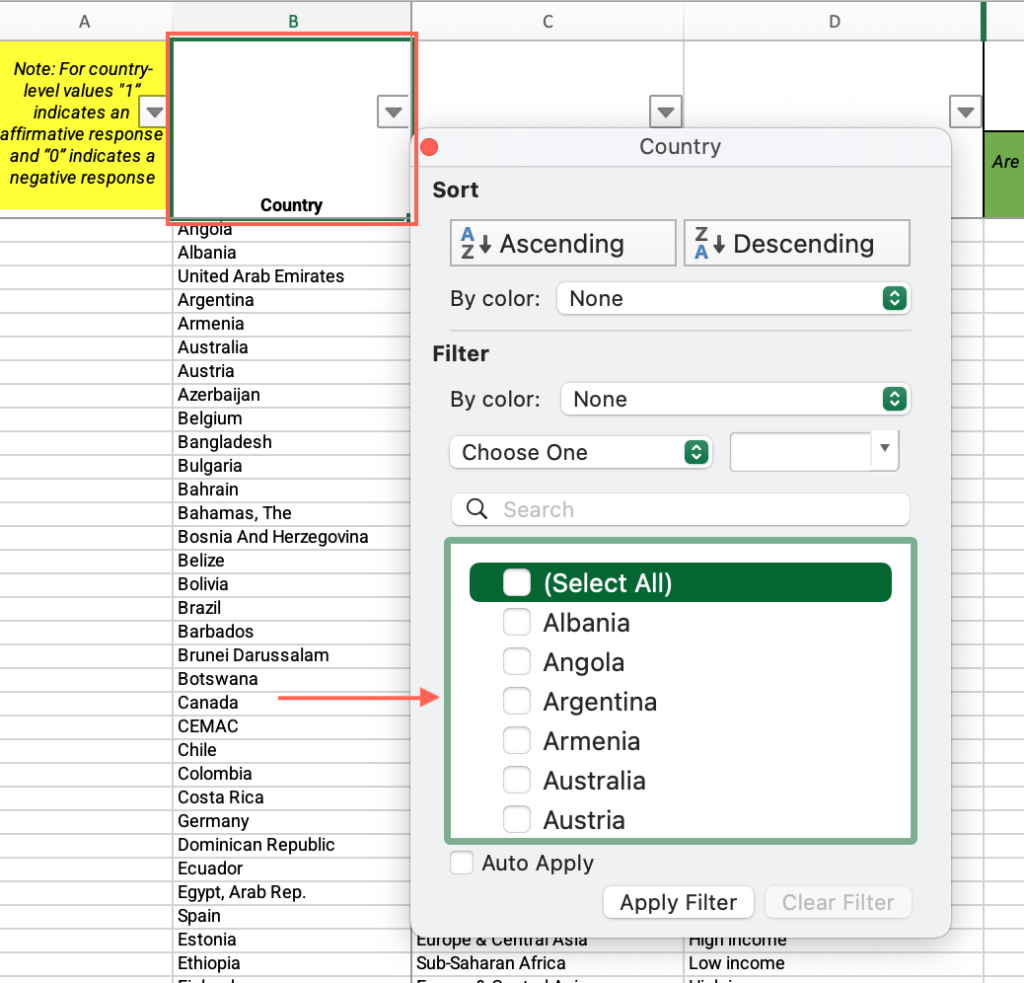
- Locate the “Country” column > Uncheck “Select all” > Check the box for your country.
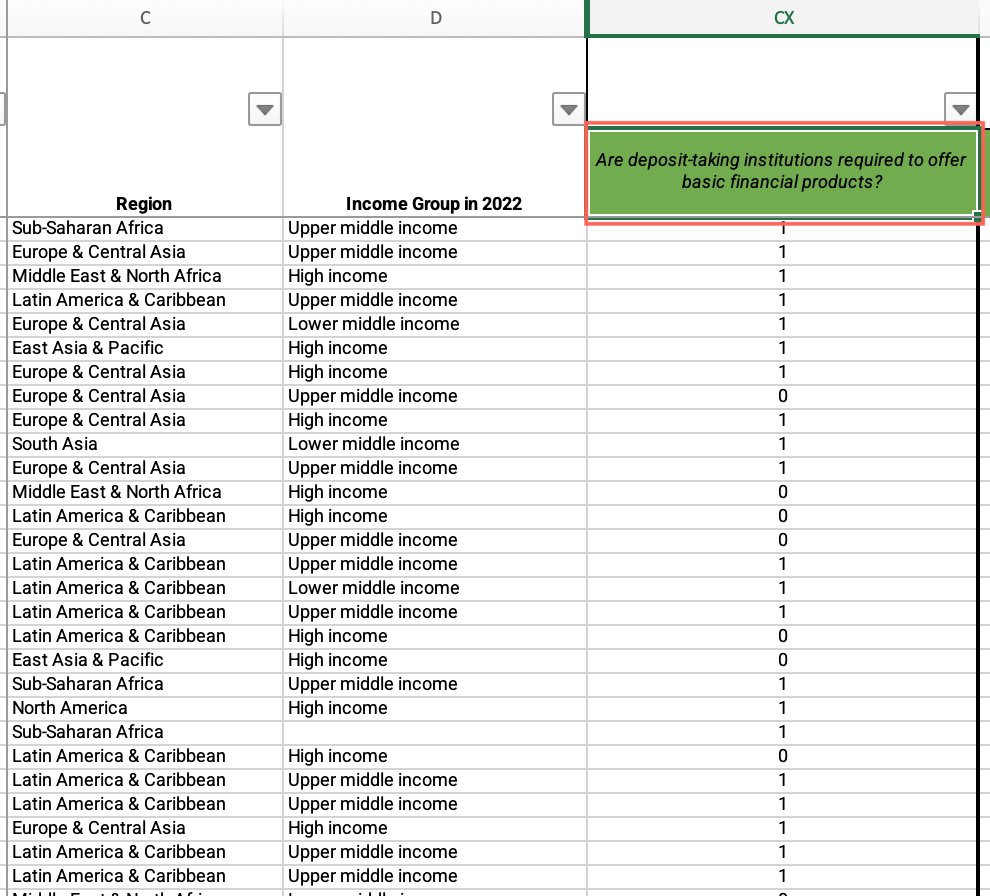
- Under the “Are deposit-taking institutions required to offer basic financial products?” column, locate the six requirements for your country and answer the question on the platform.
Step 1: According to current law or regulation, which of the following information must be submitted to open a deposit account with commercial banks?
- Open the “Step 1 – FICP CDD” sheet > Locate the “Country” column > Filter by your country.
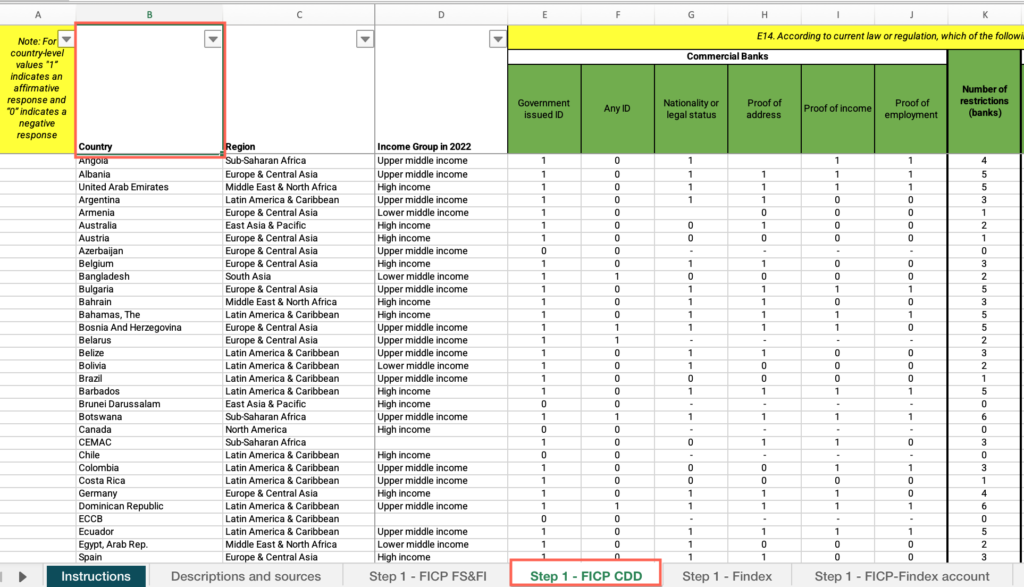
- Locate the “Which of the following information must be submitted to open a deposit account with commercial banks?” header.
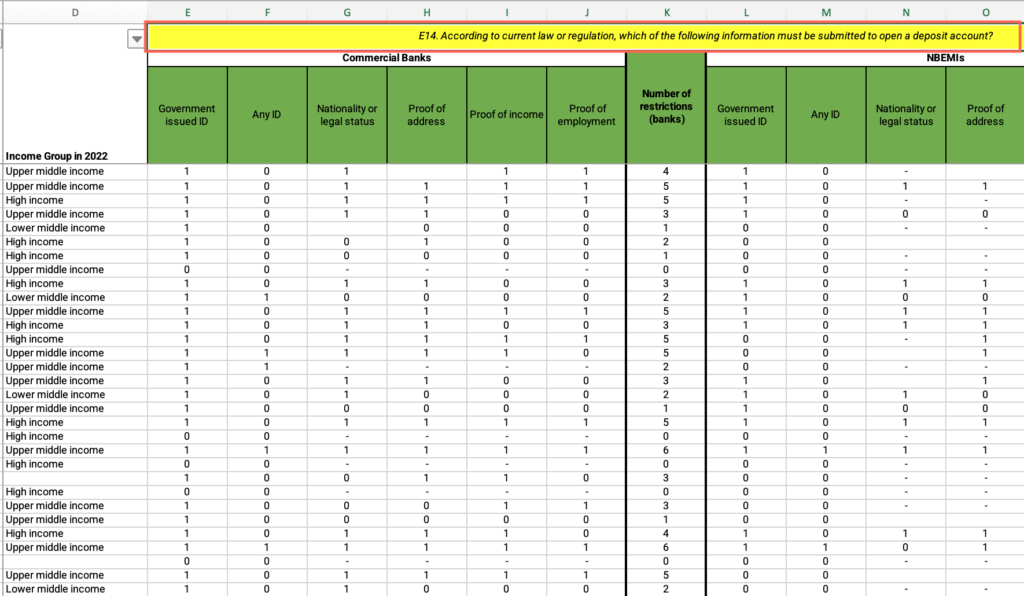
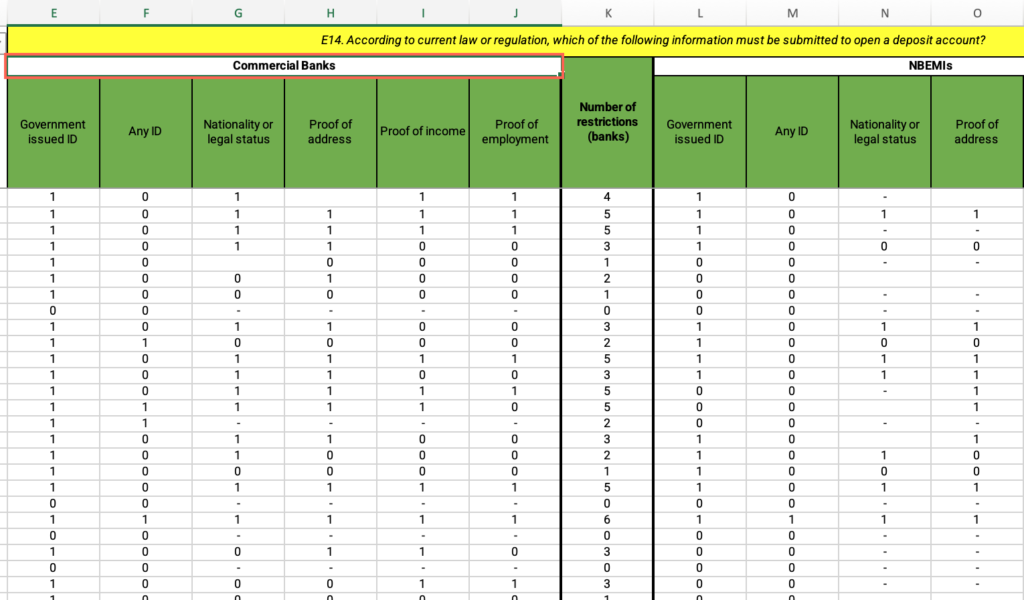
- Under the header, locate the “Commercial banks” cell >Find the six requirements for your country and answer the question on the platform.
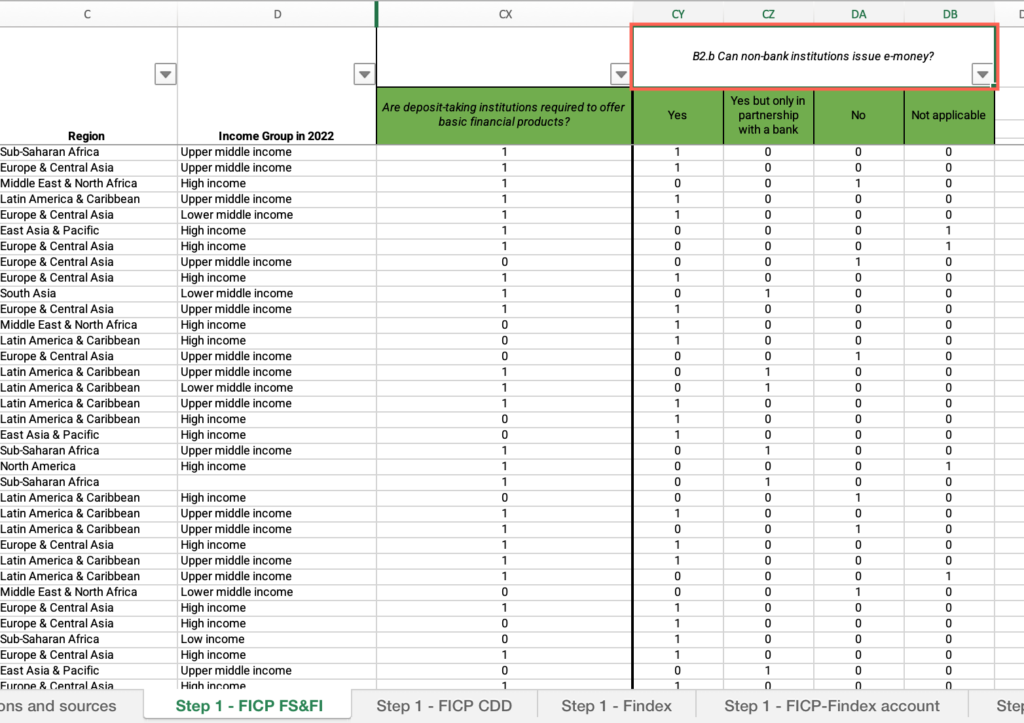
Step 1: Can non-bank institutions issue e-money in your country?
- Open the “Step 1– FICP – FI & FS” sheet.
- Locate the “Country” column > Filter by your country.
- Under the “Can non-bank institutions issue e-money in your country?” column, find your country’s value and answer the question on the platform.
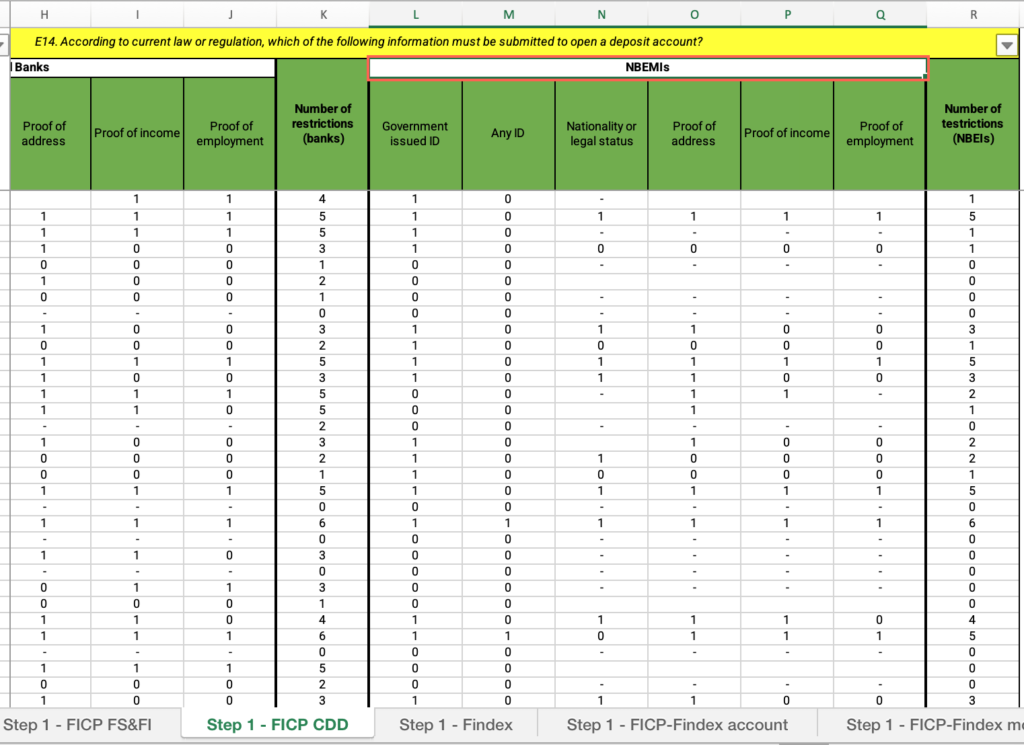
Step 1: According to current law or regulation, which of the following information must be submitted to open a deposit account with NBEIs?
- Open the “Step 1– FICP CDD” sheet.
- Locate the “Country” column > Filter by your country.
- Locate the “Which of the following information must be submitted to open a deposit account with commercial banks?” header.
- Under the header, locate the “NBEIs” cell >Find the six requirements for your country and answer the question on the platform.
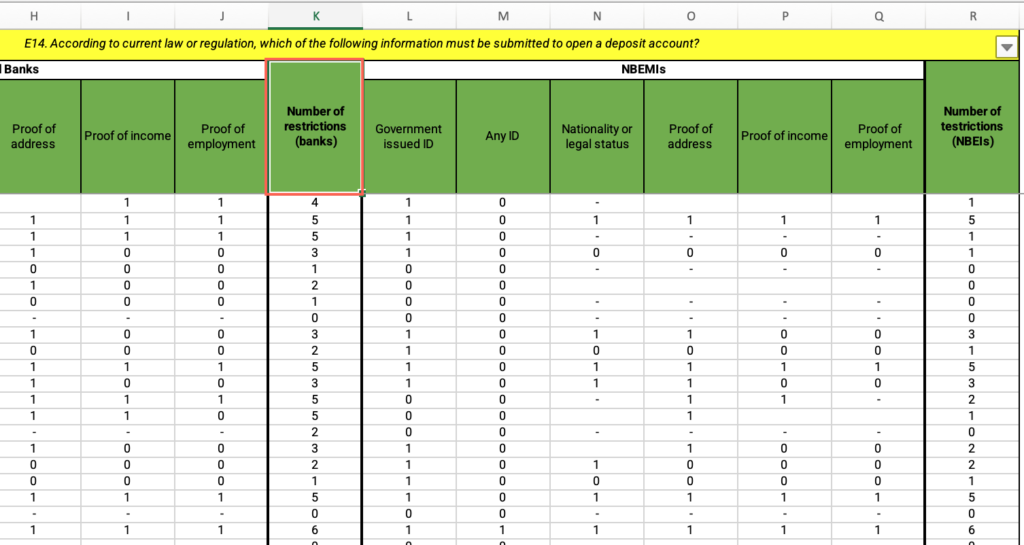
Step 1: How does your country’s restrictiveness for banks compare with countries in the same income group?
- In the “Step 1– FICP CDD” sheet, locate the “Country” column > Filter by your country.
- Locate the “Number of restrictions (banks)” column > Find your country’s value.
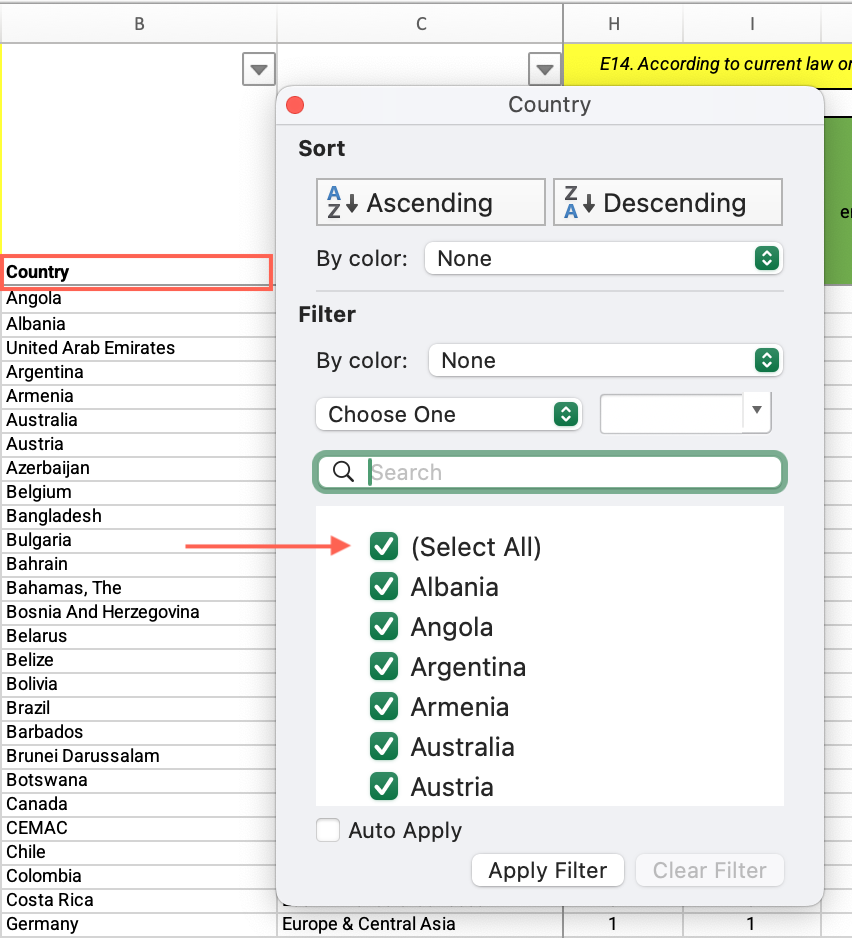
- Locate the “Country” column > Apply the filter > Check “Select all.”
- Locate the “Income group” column > Filter by your income group.
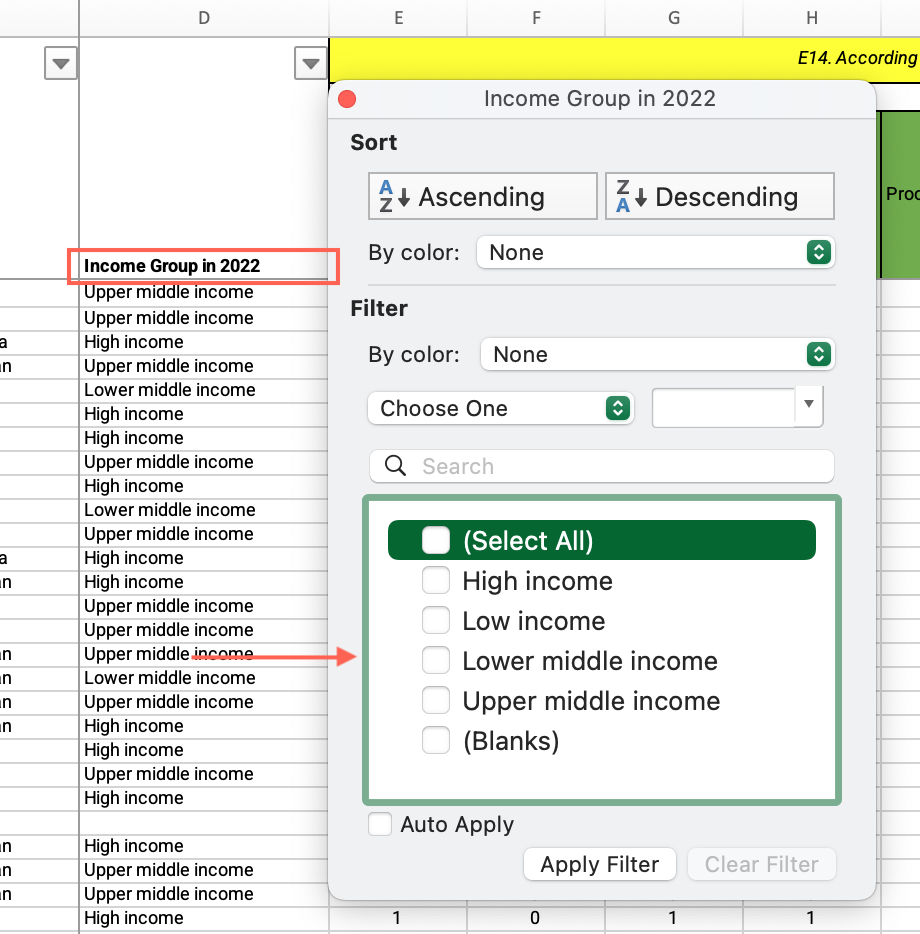
- Locate the “Number of restrictions (banks)” column > Click and drag to select the entire range of cells under this column > Find the average at the bottom of the sheet, compare it with your country’s value and answer the question on the platform.
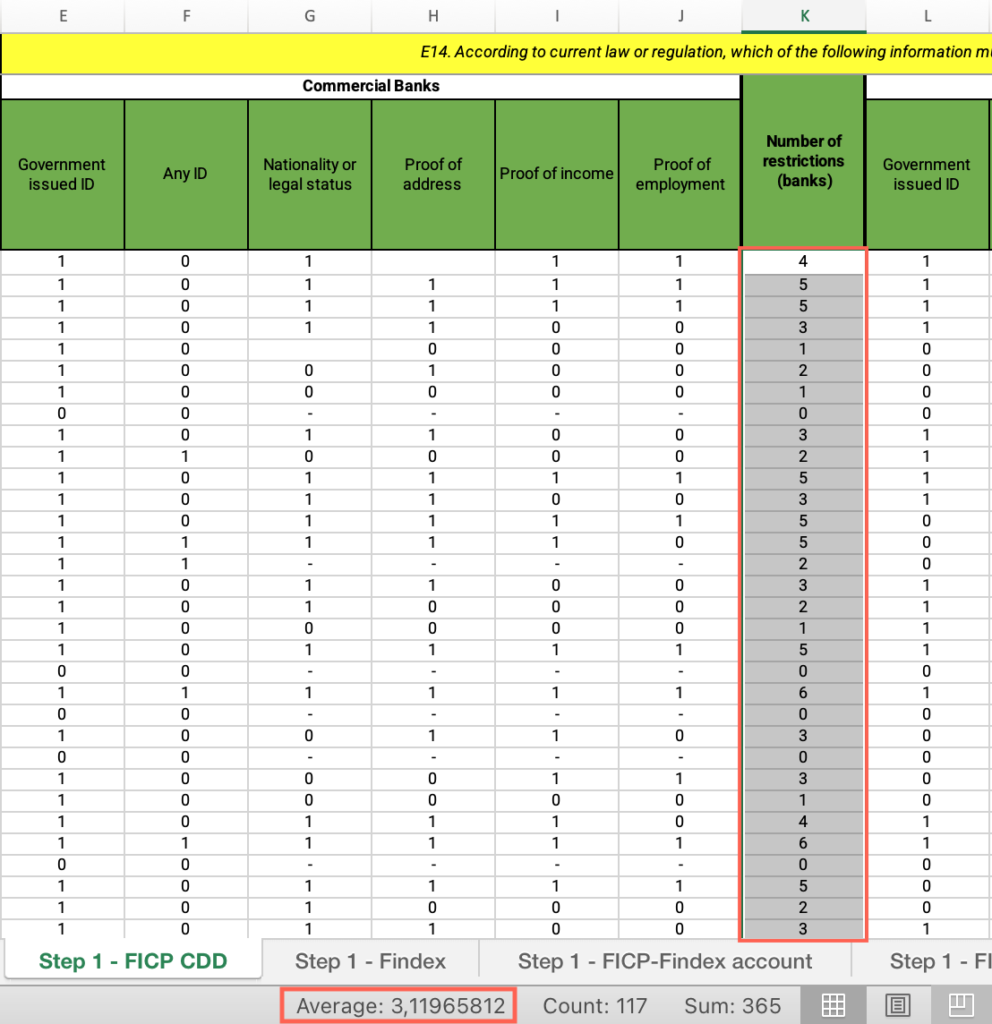
Step 1: How does your country’s restrictiveness for NBEIs compare with countries in the same income group?
- In the “Step 1– FICP CDD” sheet, locate the “Country” column > Filter by your country.
- Locate the “Number of restrictions (NBEIs)” column > Find your country’s value.
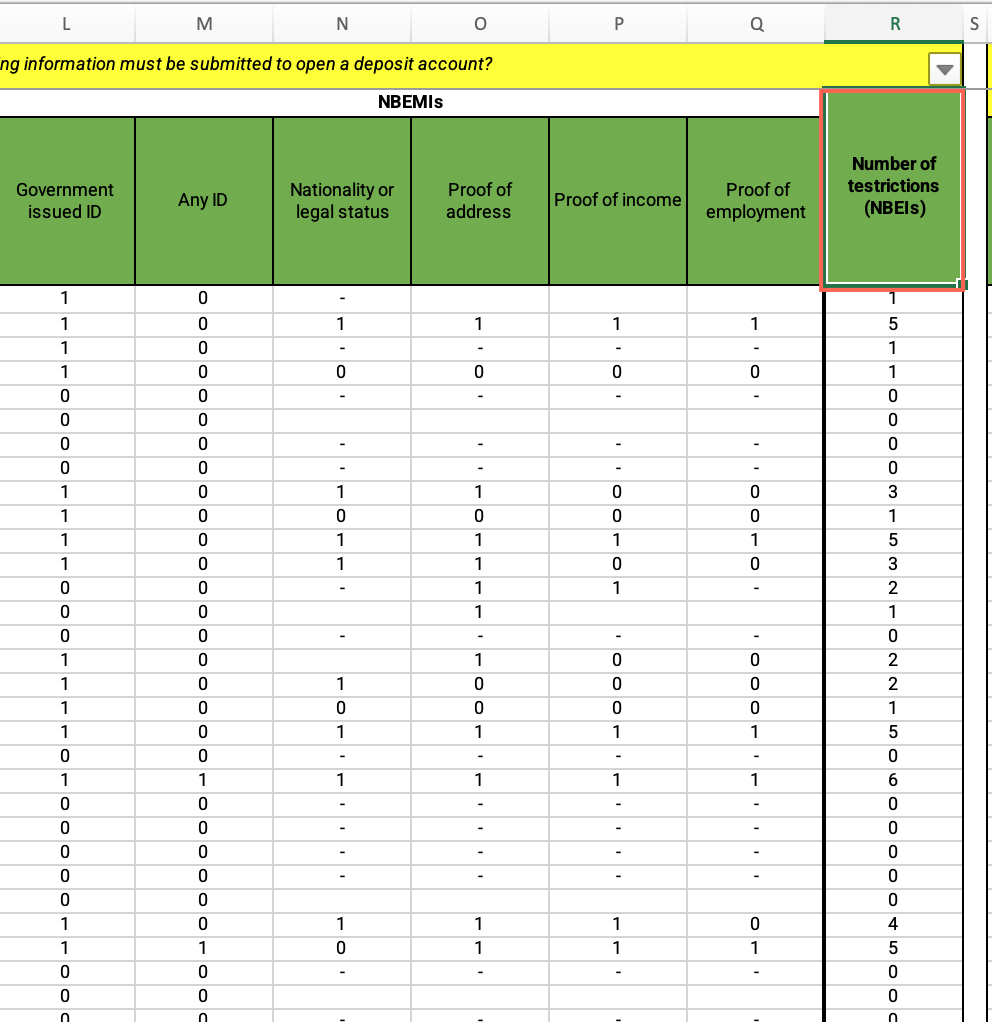
- Locate the “Country” column > Apply the filter > Check “Select all.”
- Locate the “Income group” column > Filter by your income group.
- Locate the “Number of restrictions (NBEIs)” column > Click and drag to select the entire range of cells under this column > Find the average at the bottom of the sheet, compare it with your country’s value and answer the question on the platform.
Step 1: Is remote account opening allowed?
- In the “Step 1– FICP CDD” sheet, locate the “Country” column > Filter by your country.
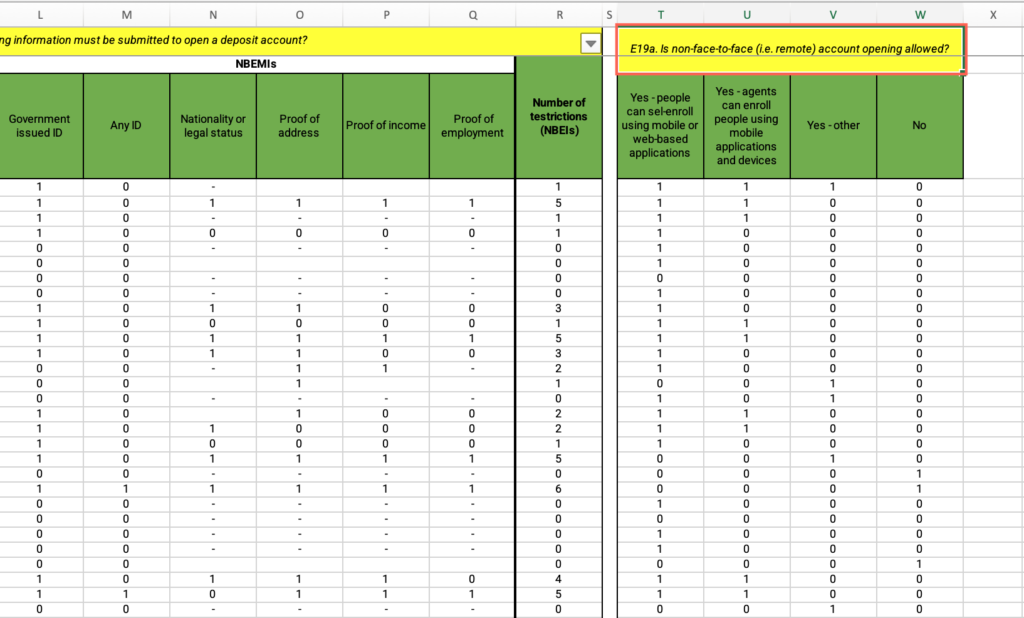
- Locate the “Is non-face-to-face (i.e. remote) account opening allowed?” cell > Find your country’s values and answer the question on the platform.
Step 1: Requirements/Account ownership graph
- Open the “Step 1 – FICP-Findex account” sheet.
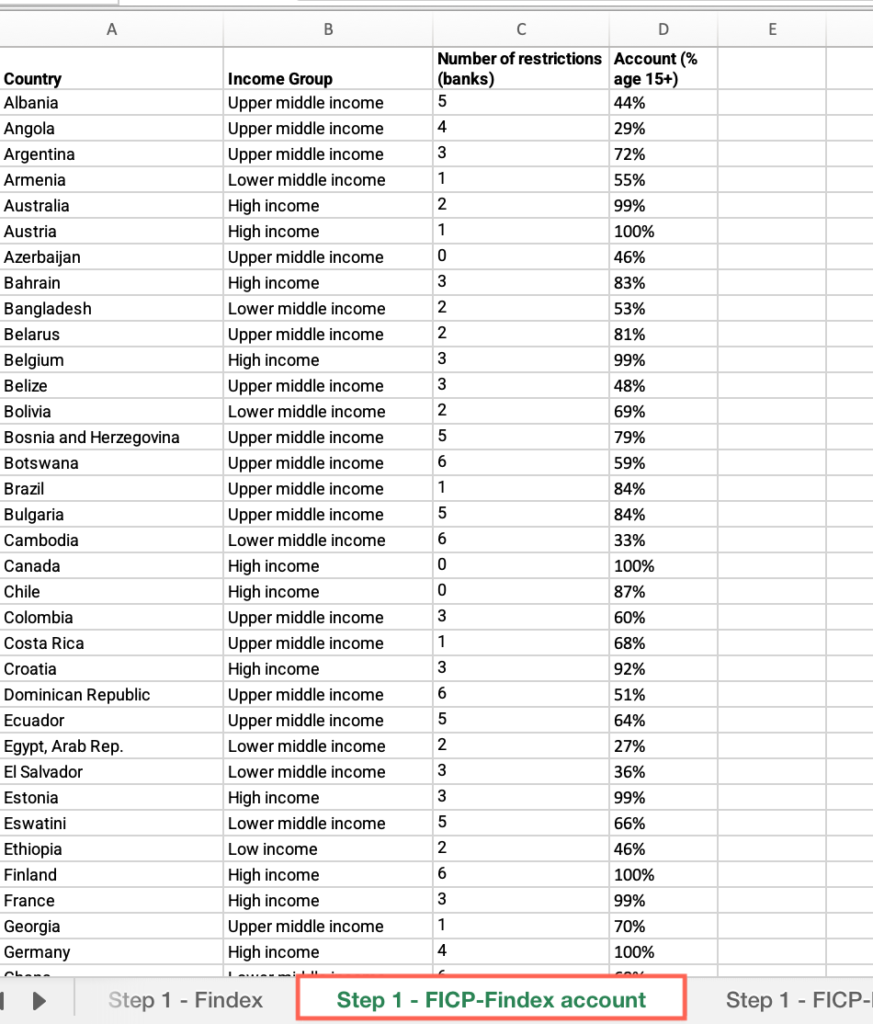
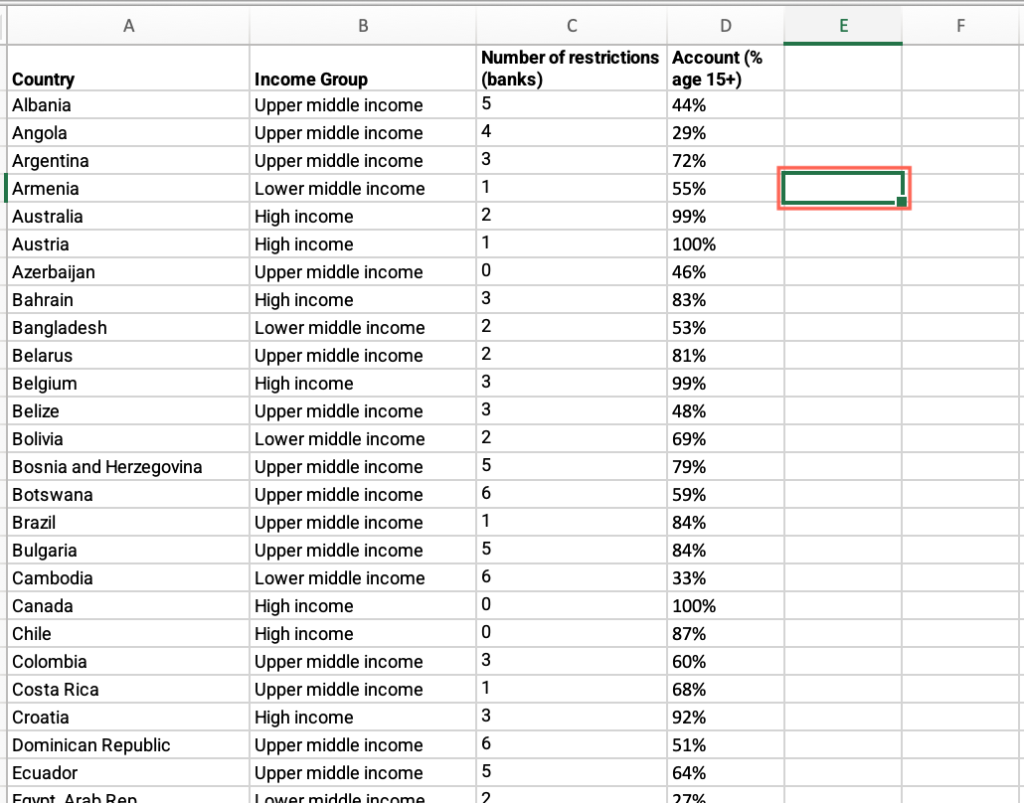
- Locate an empty cell outside the data range, not associated with any row or column containing data > Click on the empty cell.
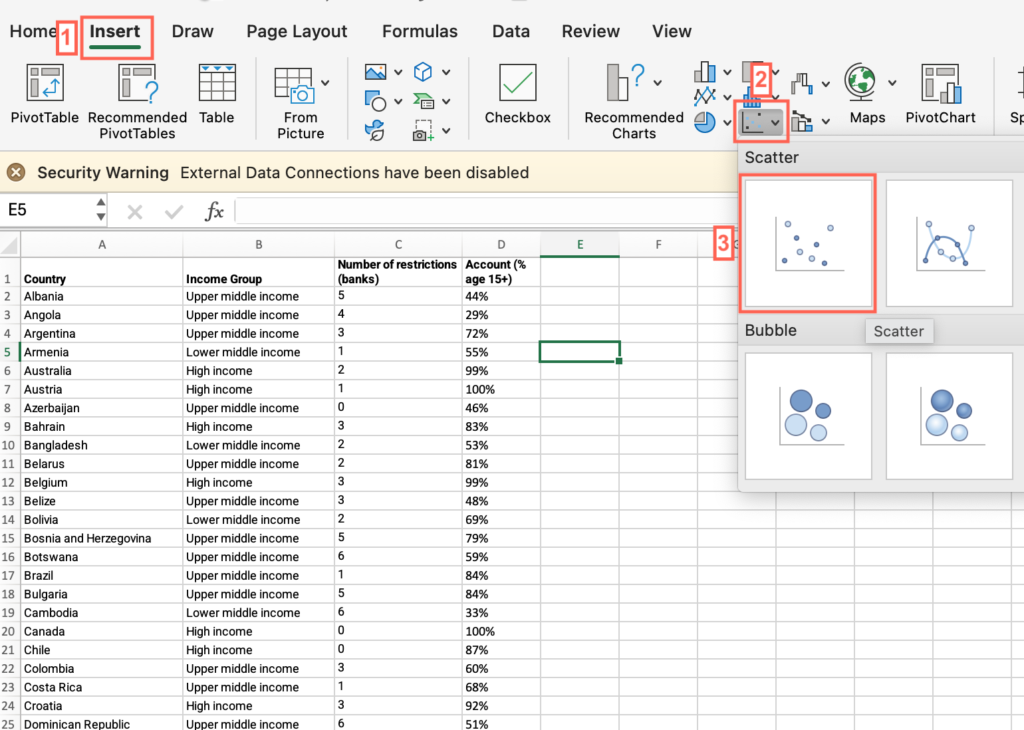
- Click the Insert menu > Locate the charts icons > click the Scatter plot icon > select “Scatter.”
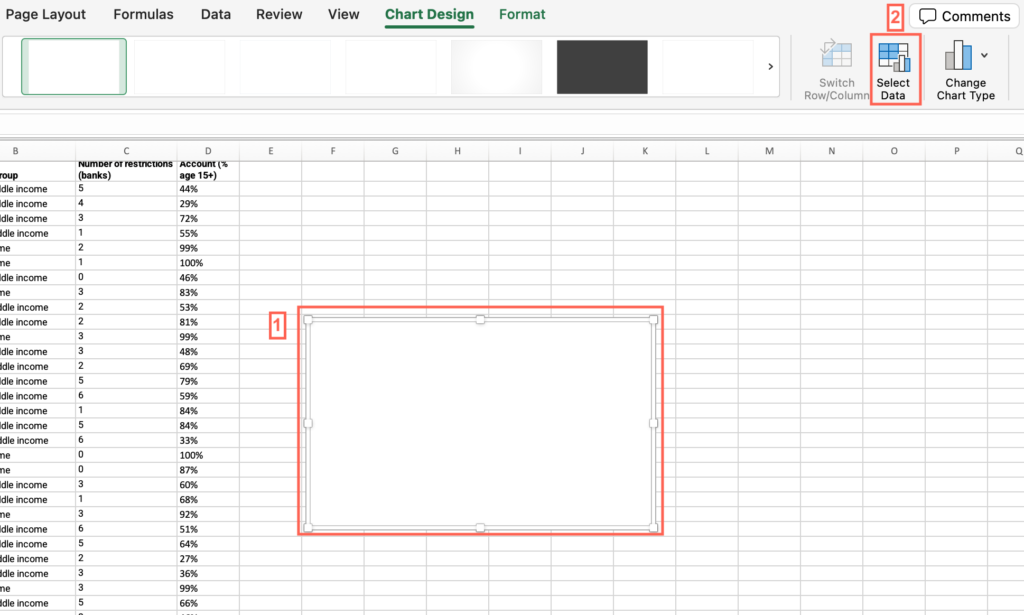
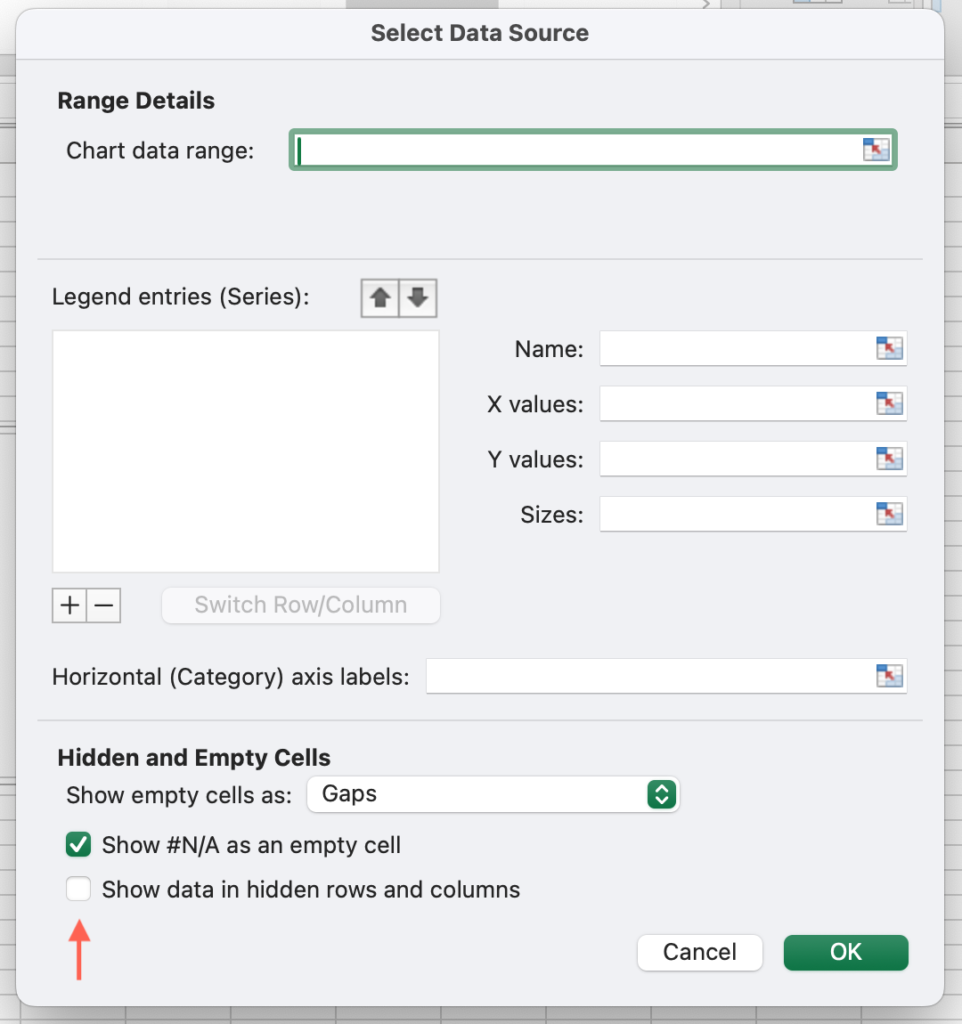
- Click on the chart area > Click the Chart Design menu > click “Select data.”
- Make sure the “Show data in hidden rows and columns” checkbox from the “Hidden and Empty Cells” options is unmarked.
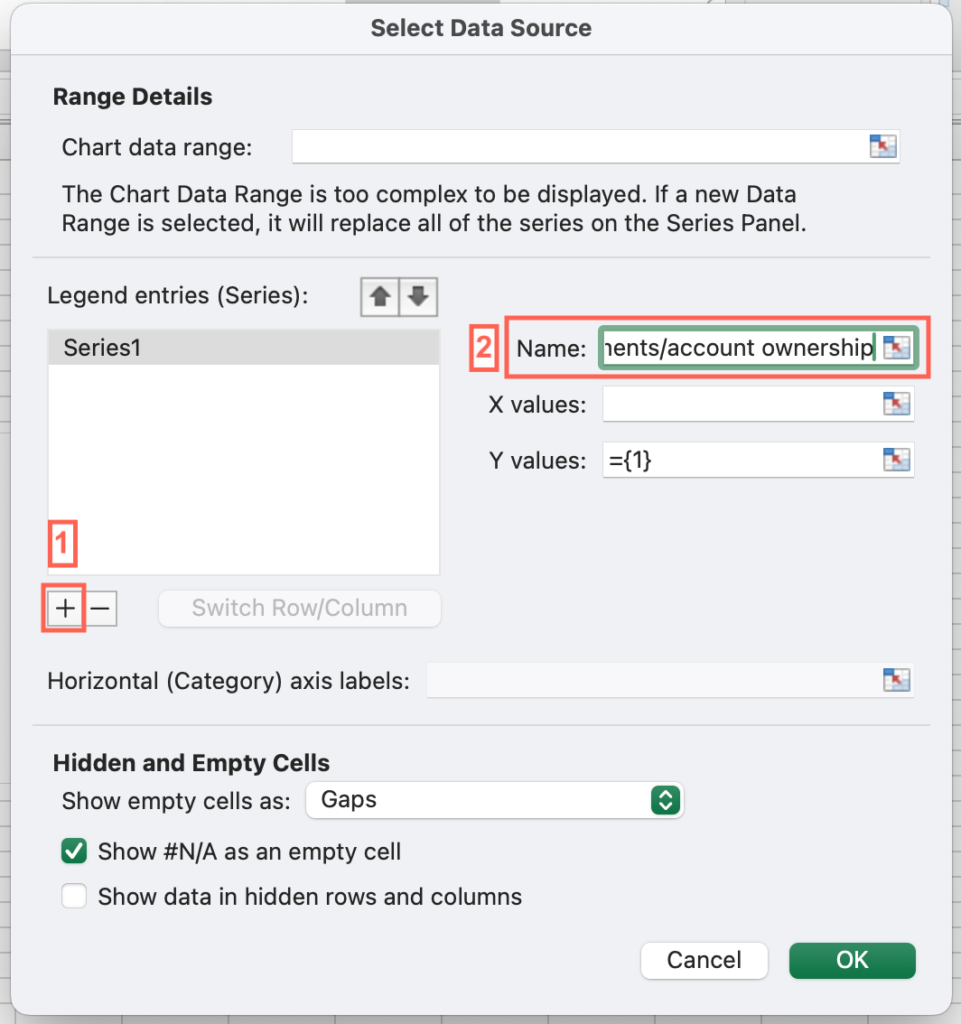
- Click on the + sign to add a series > In the “Name” field, type “Requirements/account ownership.”
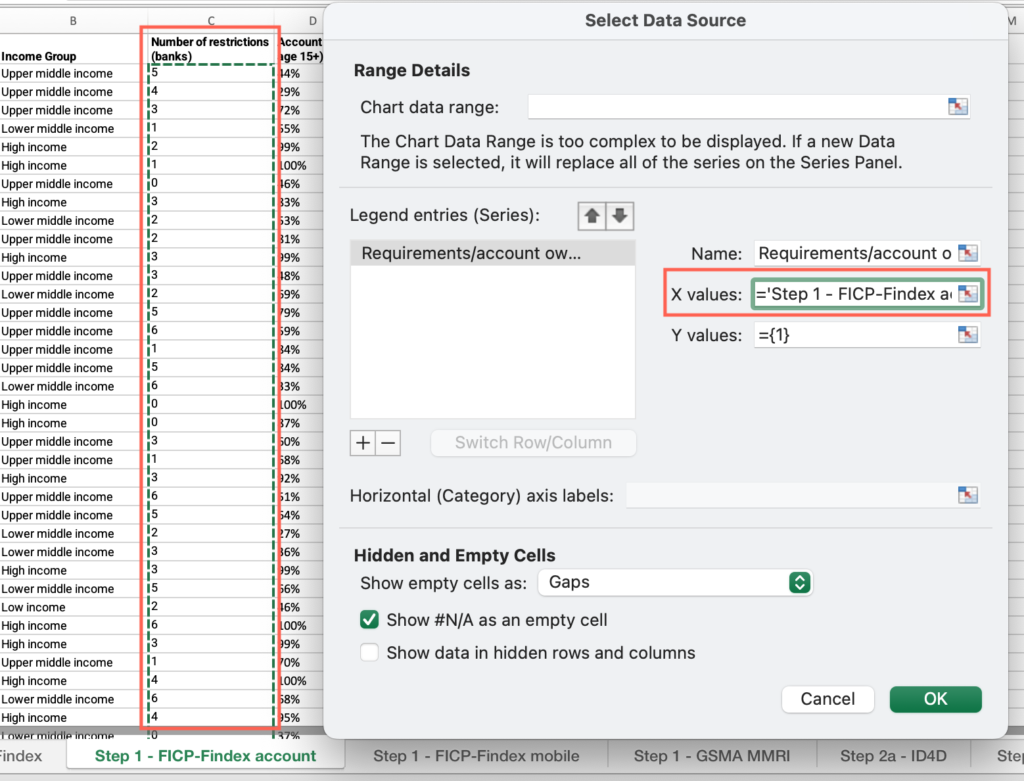
- Click the “X Values” field > Select all cells under the “Number of restrictions (banks)” column.
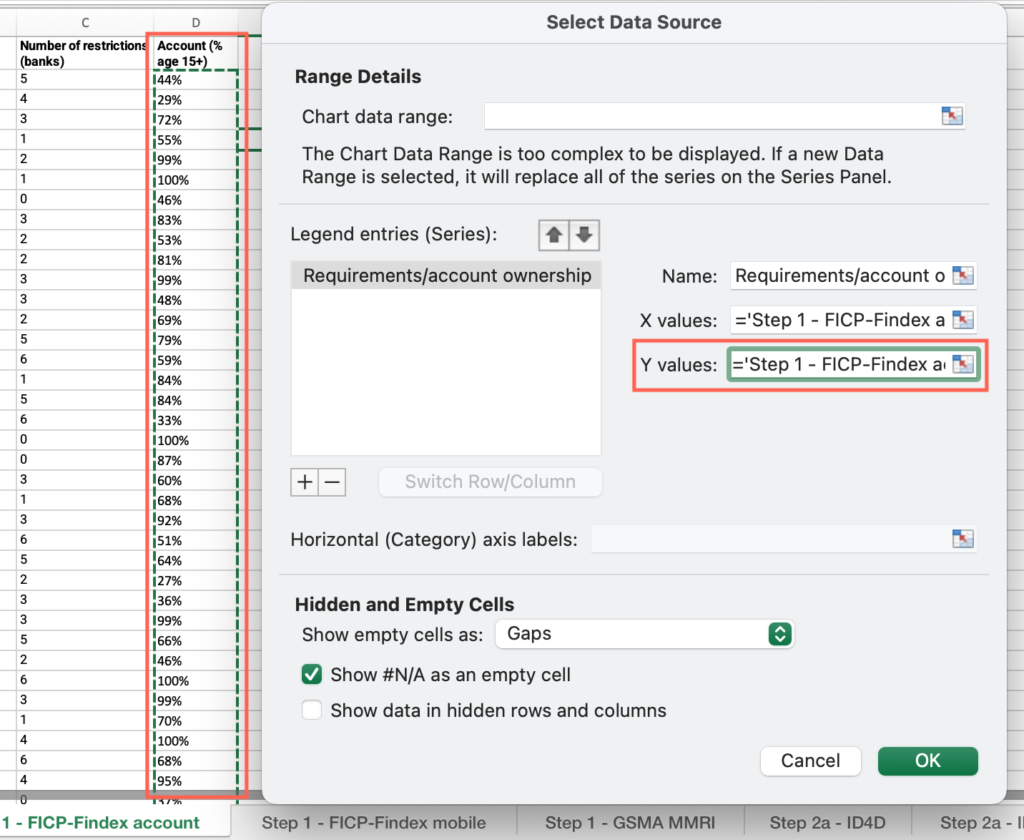
- Click the “Y Values” field > Select all cells under the “Account (% age 15+)” column and select “OK”
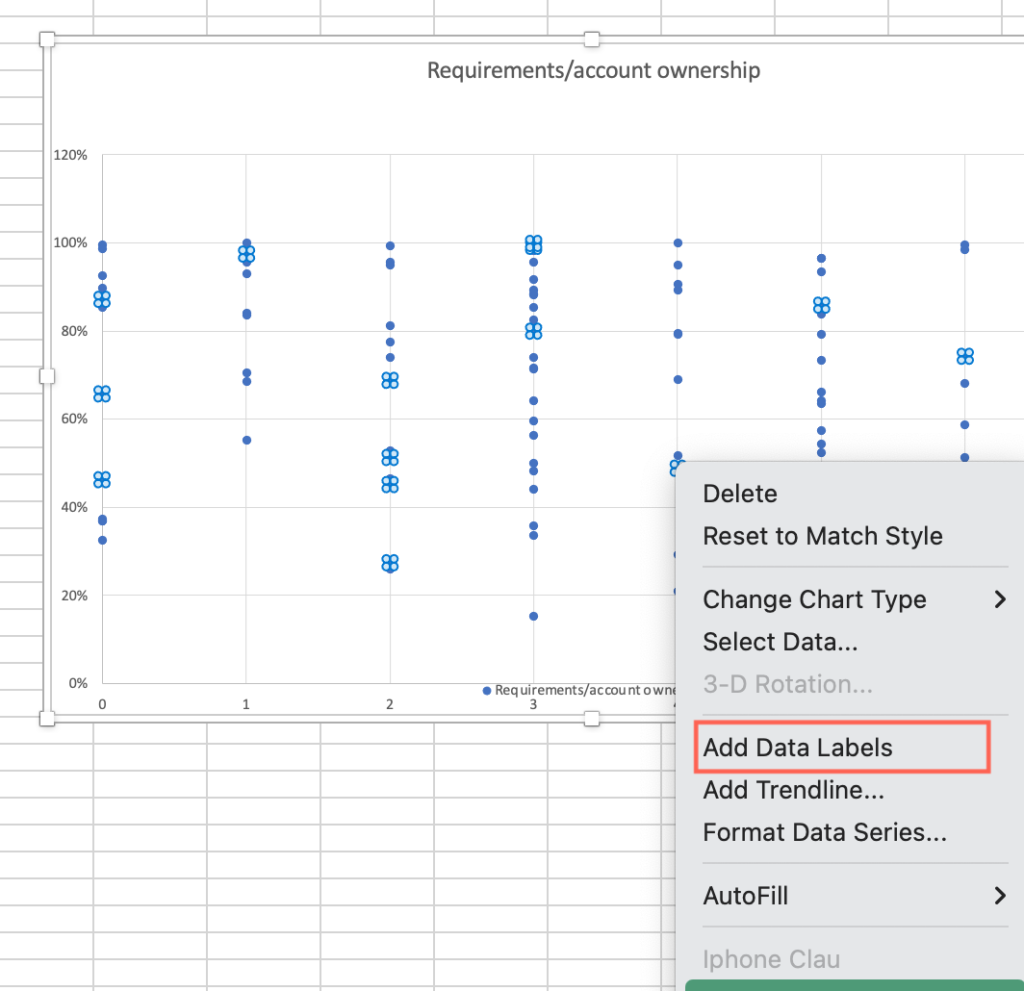
- Right click on one of the data points > select “Add data label.”
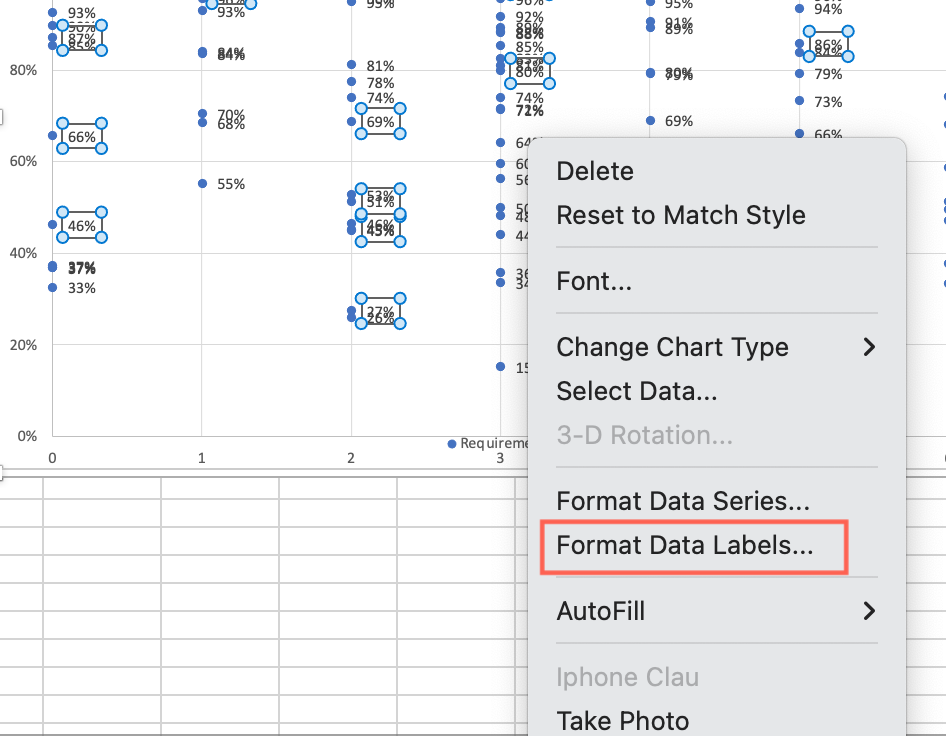
- Right click on one of the data points > select “Format data label.”
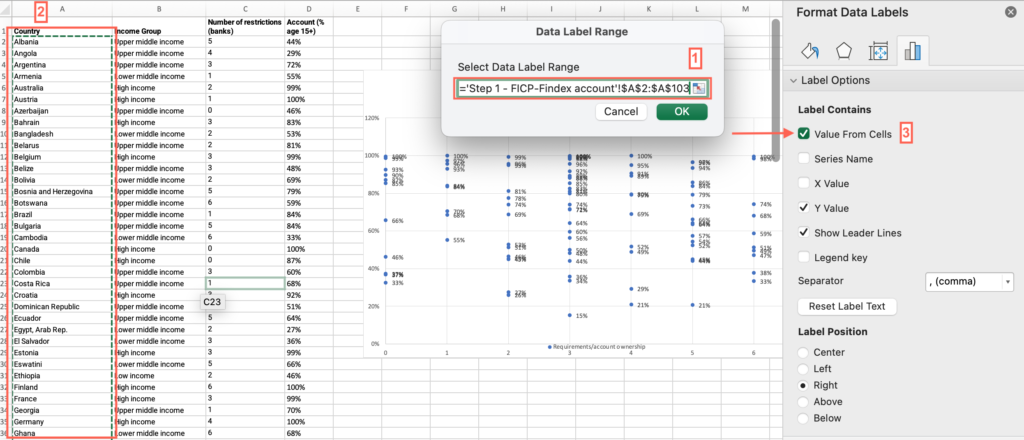
- Under “Label contains” check “Value from cells” > Select all cells with values under the “Country” column > Press OK.
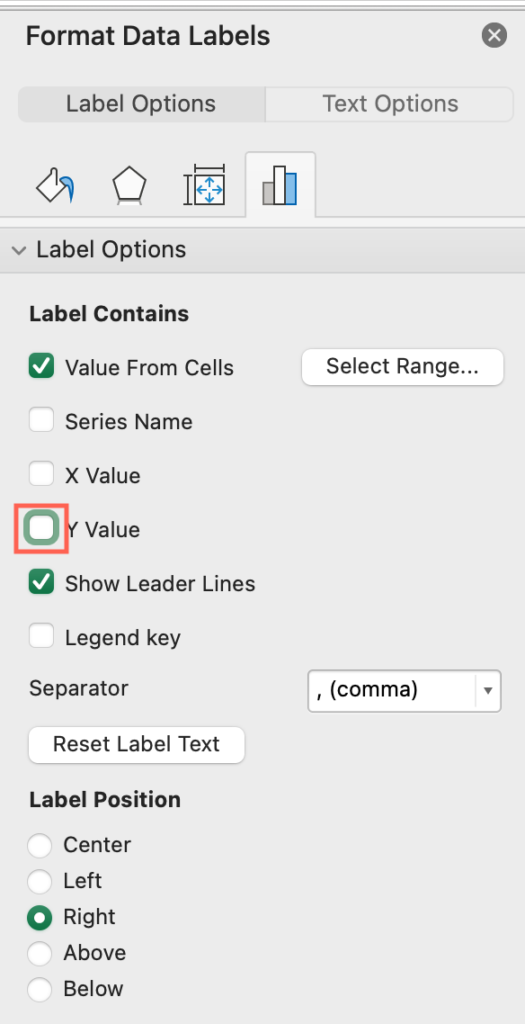
- Uncheck “Y value.”
- Analyze the output and answer the question on the platform.
Step 1: Requirements/Mobile money account ownership graph
- Open the “Step 1 – FICP-Findex mobile” sheet > Locate an empty cell outside the data range, not associated with any row or column containing data > Click on the empty cell.
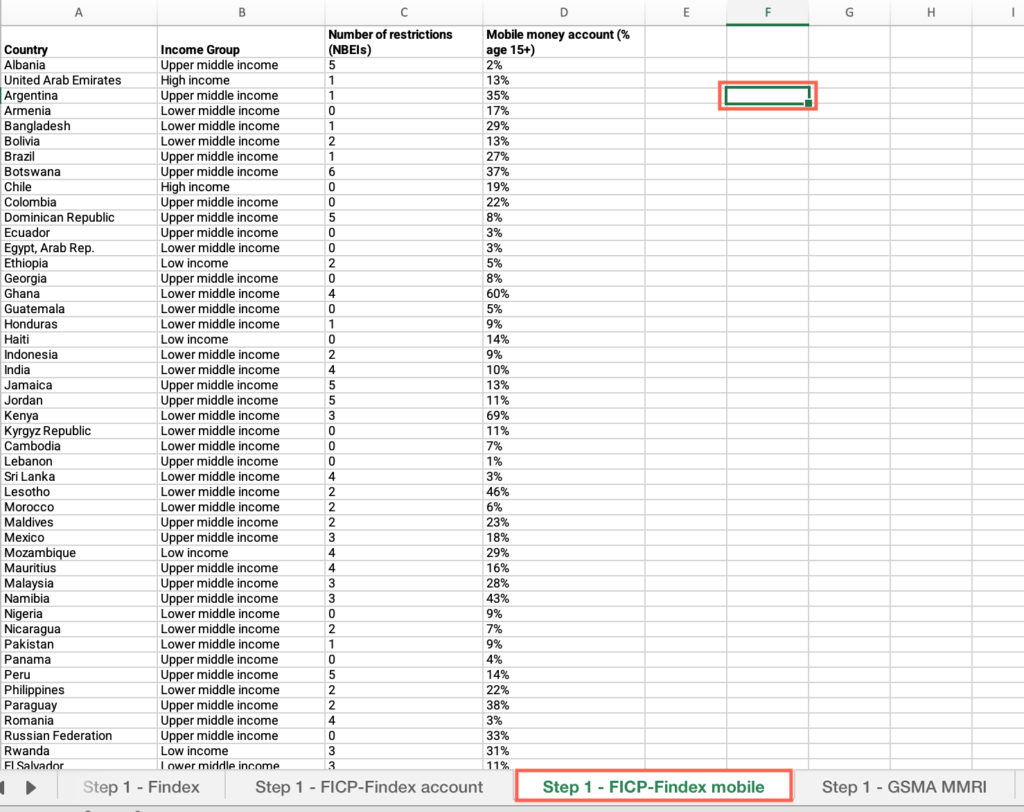
- Click the Insert menu > Locate the charts icons > click the Scatter plot icon > select “Scatter.”
- Click on the chart area > Click the Chart Design menu > click “Select data.”
- Make sure the “Show data in hidden rows and columns” checkbox from the “Hidden and Empty Cells” options is unmarked.
- Click on the + sign to add a series > In the “Name” field, type “Requirements/mobile money account ownership.”
- Click the “X Values” field > Select all cells under the “Number of restrictions (NBEIs)” column.
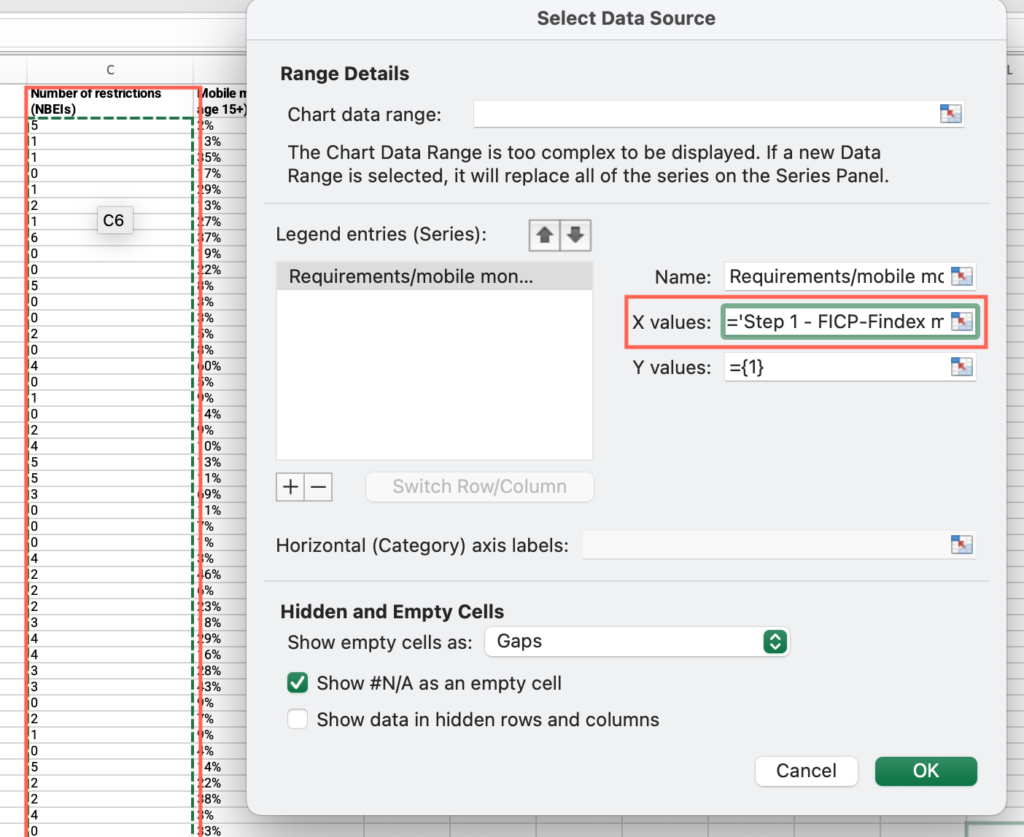
- Click the “Y Values” field > Select all cells under the “Mobile money account (% age 15+)” column. Press “OK”
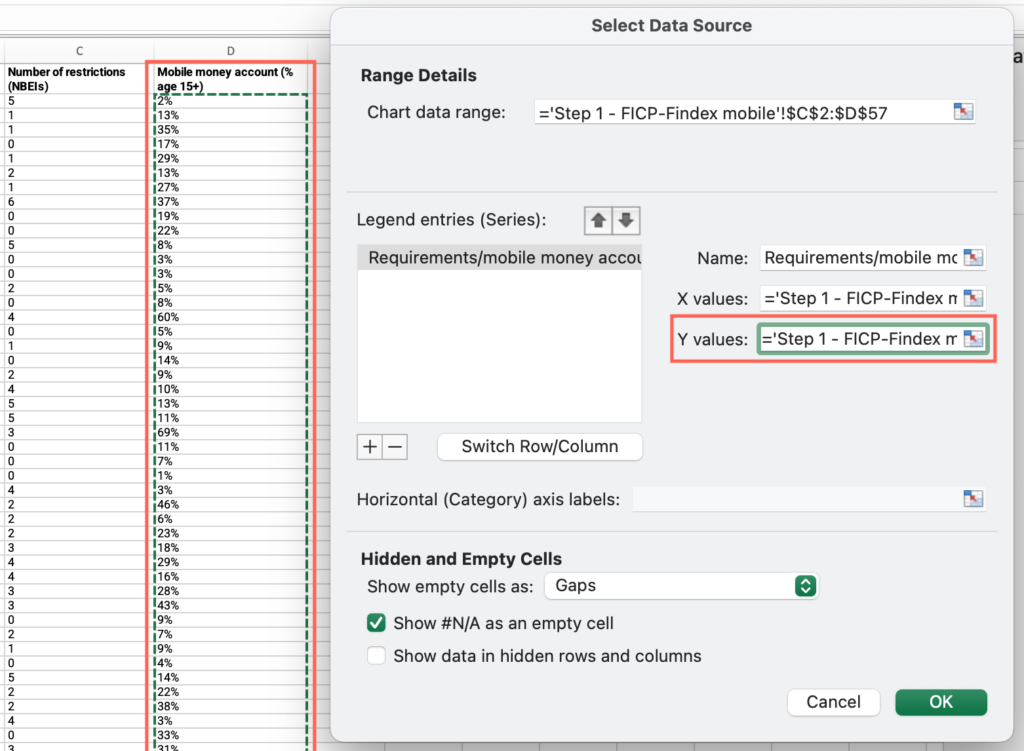
- Right click on one of the data points > select “Add data label.”
- Right click on one of the data points > select “Format data label.”
- Under “Label contains” check “Value from cells” > Select all cells with values under the “Country” column > Press OK.
- Uncheck “Y value” >Analyze the output and answer the question on the platform.
Step 1: Does your country score 0 or 100 in the Permitted identification indicator?
- Open the “Step 1 – GSMA MMRI” sheet > Locate the “Country” column > Filter by your country.
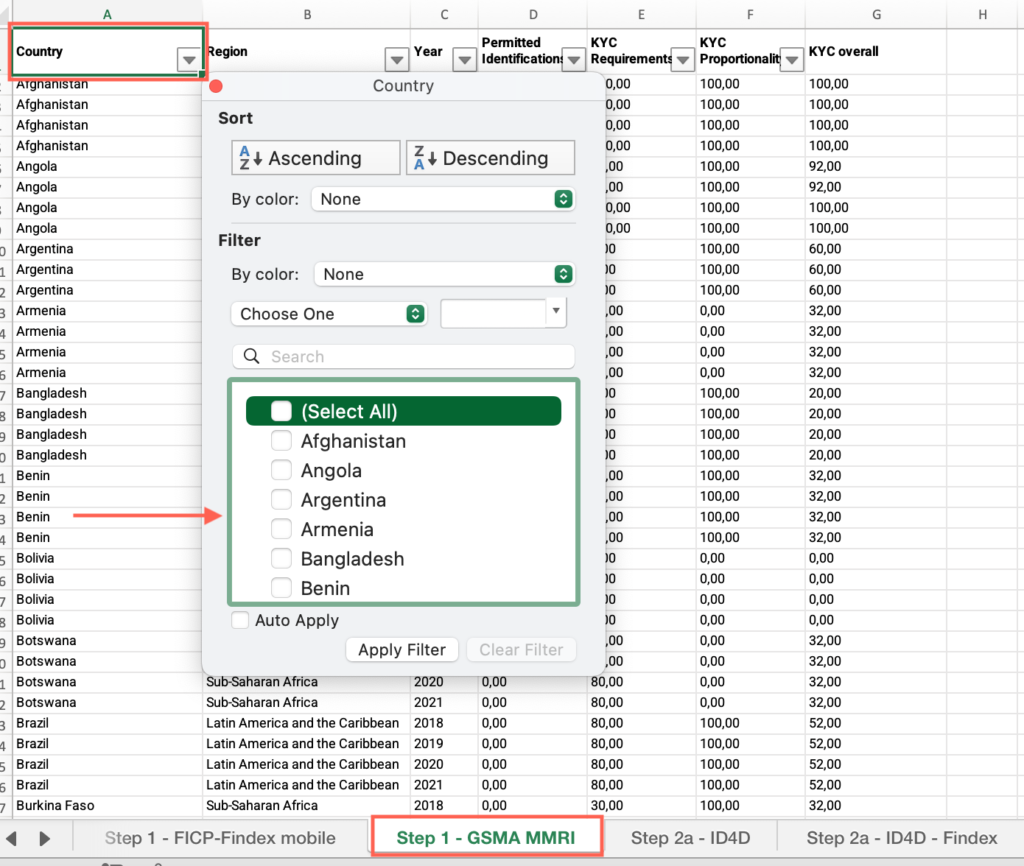
- Locate the “Year” column > Filter by the most recent year.
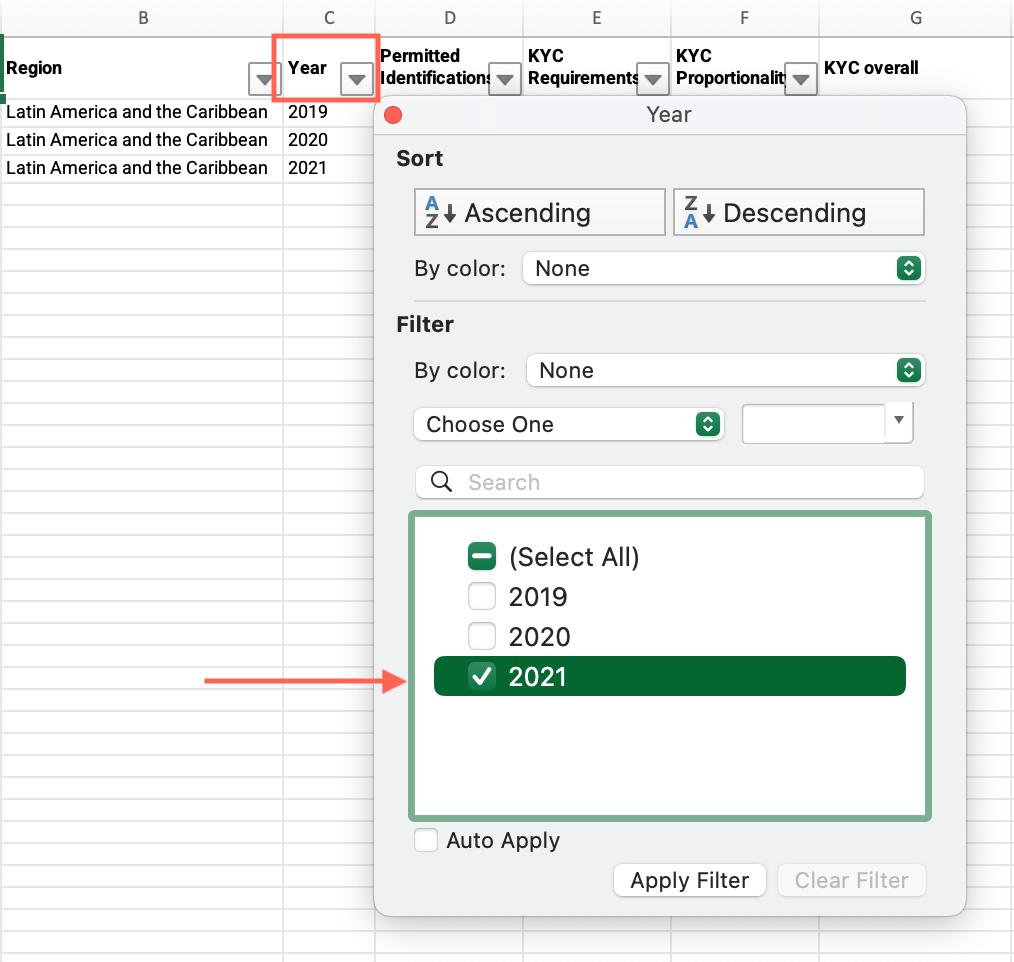
- Locate the “Permitted identification” column > Find your country’s value and answer the question on the platform.

- Repeat these steps for the “KYC requirements” and “KYC proportionality” indicators.
Step 1: In comparison: How does your country perform in the overall KYC score?
- In the “Step 1 – GSMA MMRI” sheet, locate the “Country” column > Filter by your country.
- Locate the “KYC overall” column > Find your country’s value.
- Locate the “Country” column > Apply the filter > Check “Select all.”
- Locate the “KYC overall” column > Click and drag to select the entire range of cells under this column > Find the average at the bottom of the sheet, compare it with your country’s value and answer the question on the platform.
Step 2a: What is your country’s ID ownership rate in the last year with information available?
- Open the “Step 2a – ID4D” sheet > Locate the “Country” column > Filter by your country.
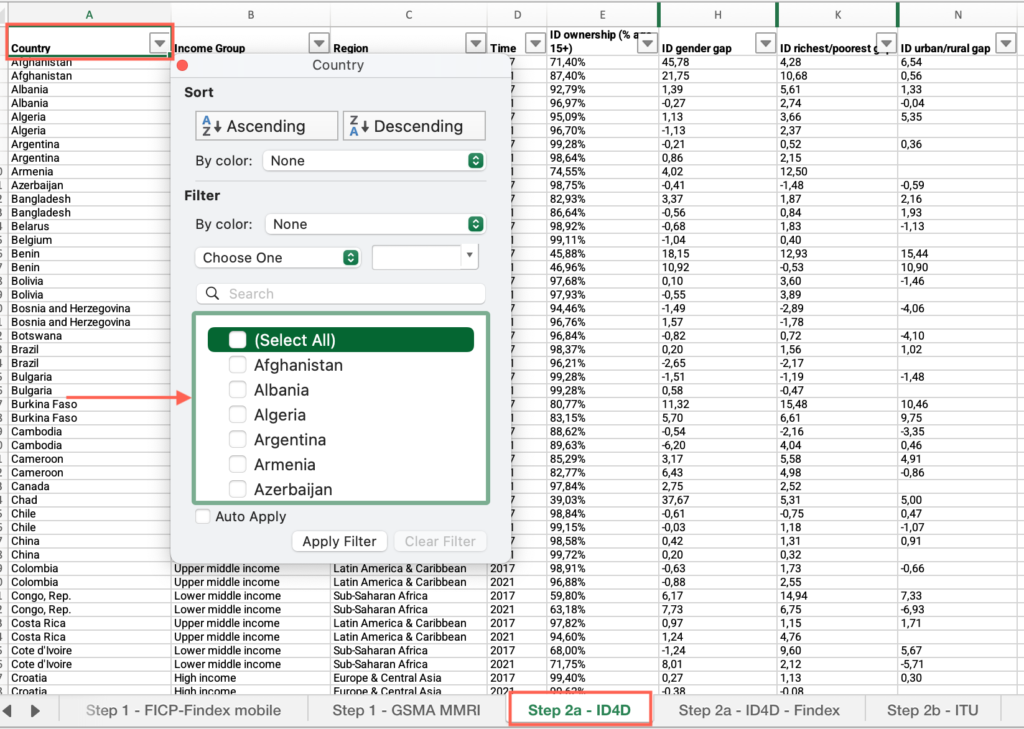
- Locate the “Year” column > Filter by the most recent year.
- Locate the “ID ownership (% age 15+)” column > Find your country’s value and answer the question on the platform.

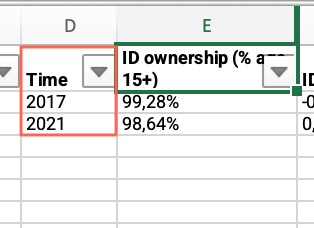
Step 2a: How has ID ownership in your country changed between 2017 and 2021?
- In the “Step 2a – ID4D” sheet > Locate the “Country” column > Filter by your country.
- Locate the “Year” column > Apply the filter > Check “Select all.”
- Locate the “ID ownership (% age 15+)” column > Compare your country’s values for both years and answer the question on the platform.
Step 2a: Compare your country’s ID ownership rate with the world average. Does your country score below the average?
- In the “Step 2a – ID4D” sheet, locate the “Country” column > Apply the filter > Check “Select all.”
- Locate the “Year” column > Filter by your country’s most recent year.
- Locate the “ID ownership (% age 15+)” column > Click and drag to select the entire range of cells under this column > Find the average at the bottom of the sheet, compare it with your country’s value and answer the question on the platform.
Step 2a: Does your country’s ID ownership rate score below the regional average?
- In the “Step 2a – ID4D” sheet, locate the “Country” column > Apply the filter > Check “Select all.”
- Locate the “Year” column > Filter by your country’s most recent year.
- Locate the “Region” column > Filter by your region.
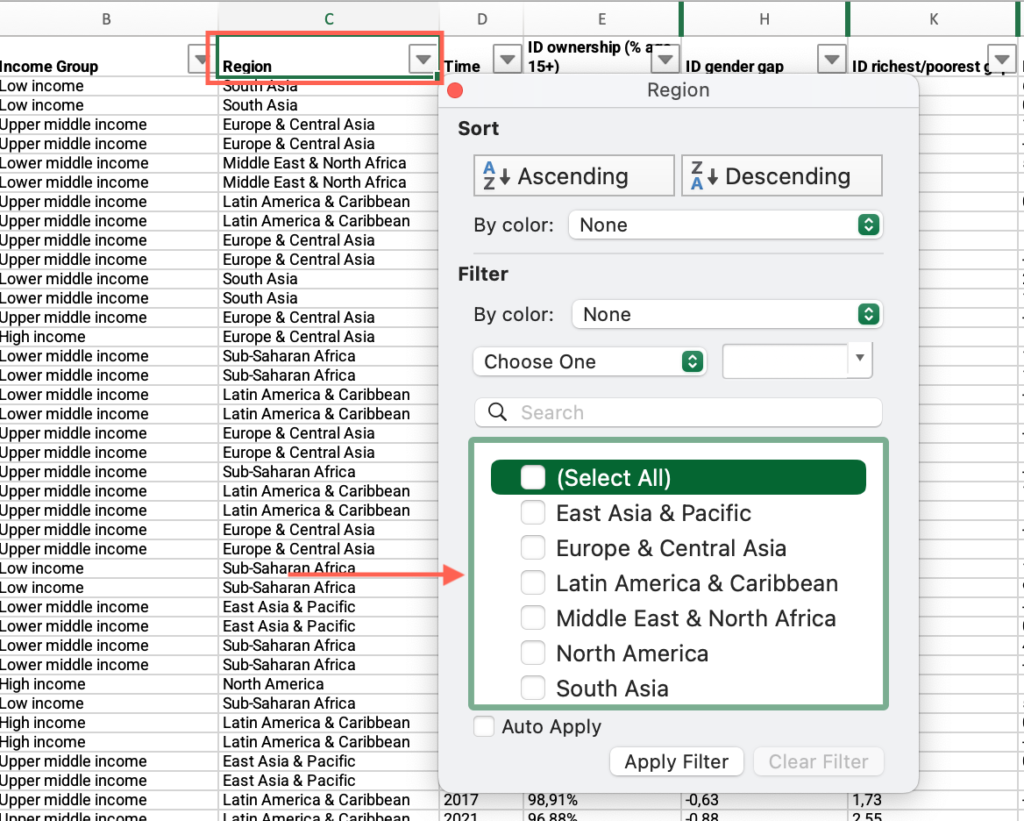
- Locate the “ID ownership (% age 15+)” column > Click and drag to select the entire range of cells under this column > Find the average at the bottom of the sheet, compare it with your country’s value and answer the question on the platform.
Step 2a: Does your country’s ID ownership rate score below your income group average?
- In the “Step 2a – ID4D” sheet, locate the “Country” column > Apply the filter > Check “Select all.”
- Locate the “Year” column > Filter by your country’s most recent year.
- Locate the “Income group” column > Filter by your income group.
- Locate the “ID ownership (% age 15+)” column > Click and drag to select the entire range of cells under this column > Find the average at the bottom of the sheet, compare it with your country’s value and answer the question on the platform
Step 2a: What is the gap in ID ownership between men and women?
- In the “Step 2a – ID4D” sheet, locate the “Country” column > Filter by your country.
- Locate the “Year” column > Filter by your country’s most recent year.
- Locate the “ID gender gap” column > Find your country’s value and answer the question on the platform.
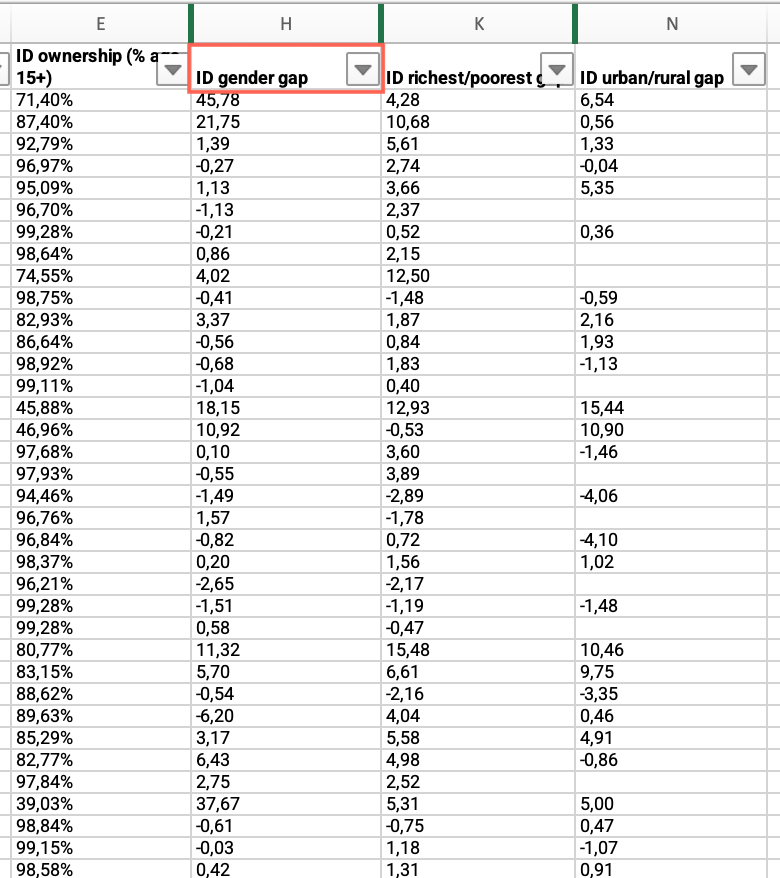
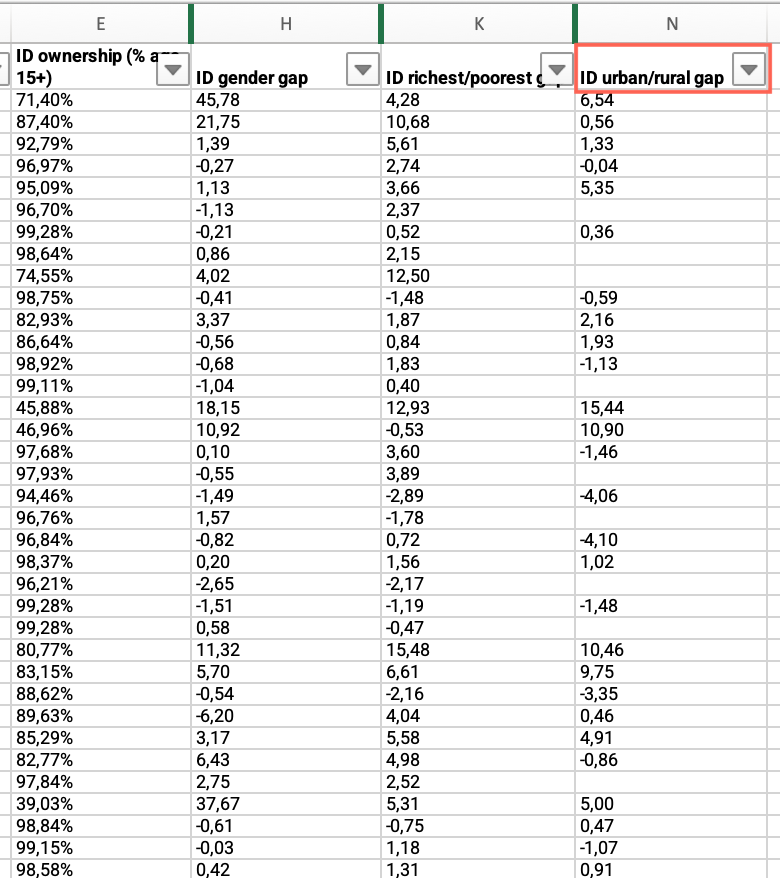
Step 2a: What is the gap in ID ownership between urban and rural population?
- In the “Step 2a – ID4D” sheet, locate the “Country” column > Filter by your country.
- Locate the “Year” column > Filter by your country’s most recent year.
- Locate the “ID urban/rural gap” column > Find your country’s value and answer the question on the platform.
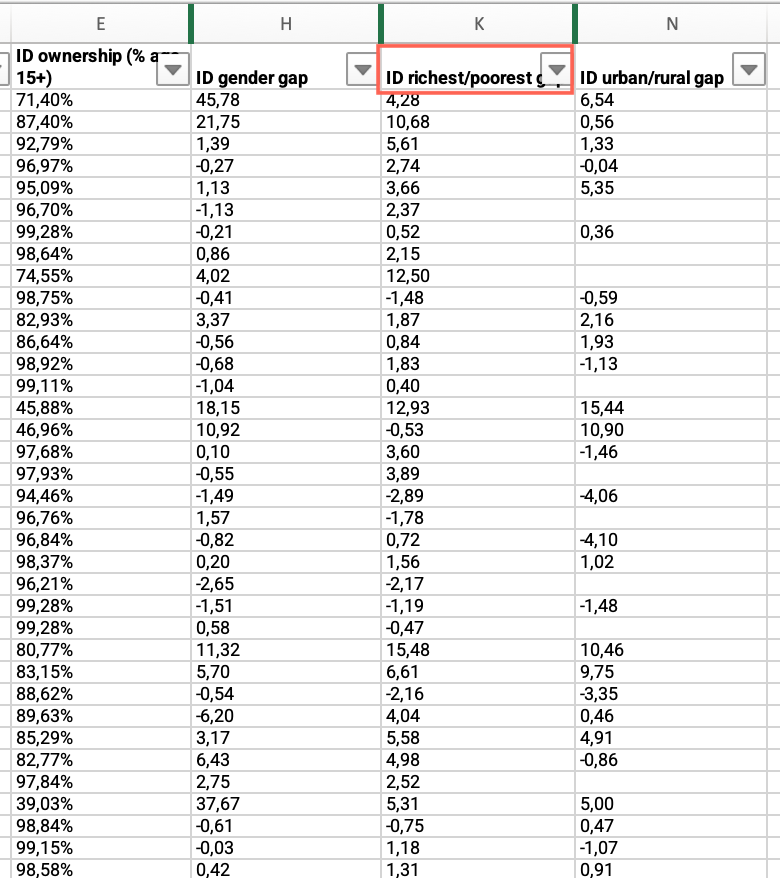
Step 2a: What is the gap in ID ownership between richest and poorest population?
- In the “Step 2a – ID4D” sheet, locate the “Country” column > Filter by your country.
- Locate the “Year” column > Filter by your country’s most recent year.
- Locate the “ID richest/poorest gap” column > Find your country’s value and answer the question on the platform.
Step 2a: Is your country’s gender gap (Male/Female) significantly above your income group average?
- In the “Step 2a – ID4D” sheet, locate the “Country” column > Apply the filter > Check “Select all.”
- Locate the “Year” column > Filter by your country’s most recent year.
- Locate the “Income group” column > Filter by your income group.
- Locate the “ID gender gap” column > Click and drag to select the entire range of cells under this column > Find the average at the bottom of the sheet, compare it with your country’s value and answer the question on the platform.
Step 2a: Is your country’s location gap (Urban/Rural) significantly above your income group average?
- In the “Step 2a – ID4D” sheet, locate the “Country” column > Apply the filter > Check “Select all.”
- Locate the “Year” column > Filter by your country’s most recent year.
- Locate the “Income group” column > Filter by your income group.
- Locate the “ID urban/rural gap” column > Click and drag to select the entire range of cells under this column > Find the average at the bottom of the sheet, compare it with your country’s value and answer the question on the platform.
Step 2a: Is your country’s population income gap (Poorest/Richest) significantly above your income group average?
- In the “Step 2a – ID4D” sheet, locate the “Country” column > Apply the filter > Check “Select all.”
- Locate the “Year” column > Filter by your country’s most recent year.
- Locate the “Income group” column > Filter by your income group.
- Locate the “ID richest/poorest gap” column > Click and drag to select the entire range of cells under this column > Find the average at the bottom of the sheet, compare it with your country’s value and answer the question on the platform.
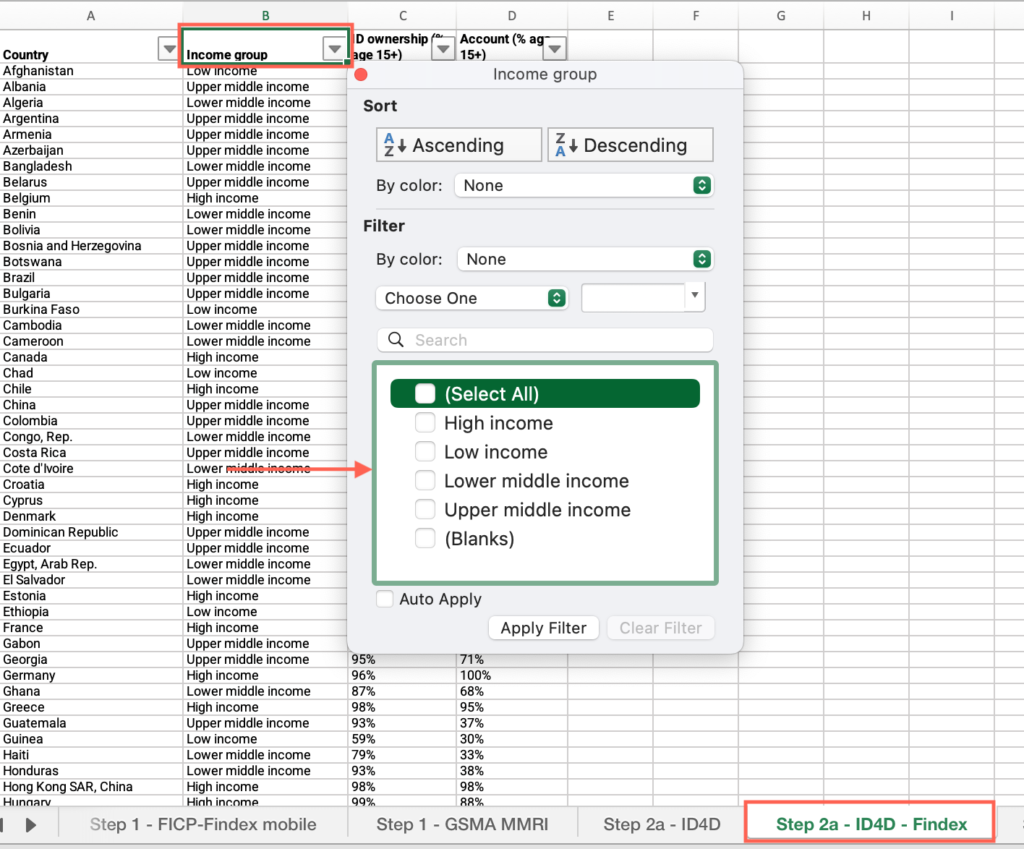
Step 2a: Which option best represents your country?
- Open the “Step 2a – ID4D – Findex” sheet > Locate the “Income group” column > Filter by your income group.
- Locate an empty cell outside the data range, not associated with any row or column containing data > Click on the empty cell.
- Click the Insert menu > Locate the charts icons > click the Scatter plot icon > select “Scatter.”
- Click on the chart area > Click the Chart Design menu > click “Select data.”
- Make sure the “Show data in hidden rows and columns” checkbox from the “Hidden and Empty Cells” options is unmarked.
- Click on the + sign to add a series > In the “Name” field, type “ID/ account ownership.”
- Click the “X Values” field > Select all cells under the “ID ownership (% age 15+)” column.
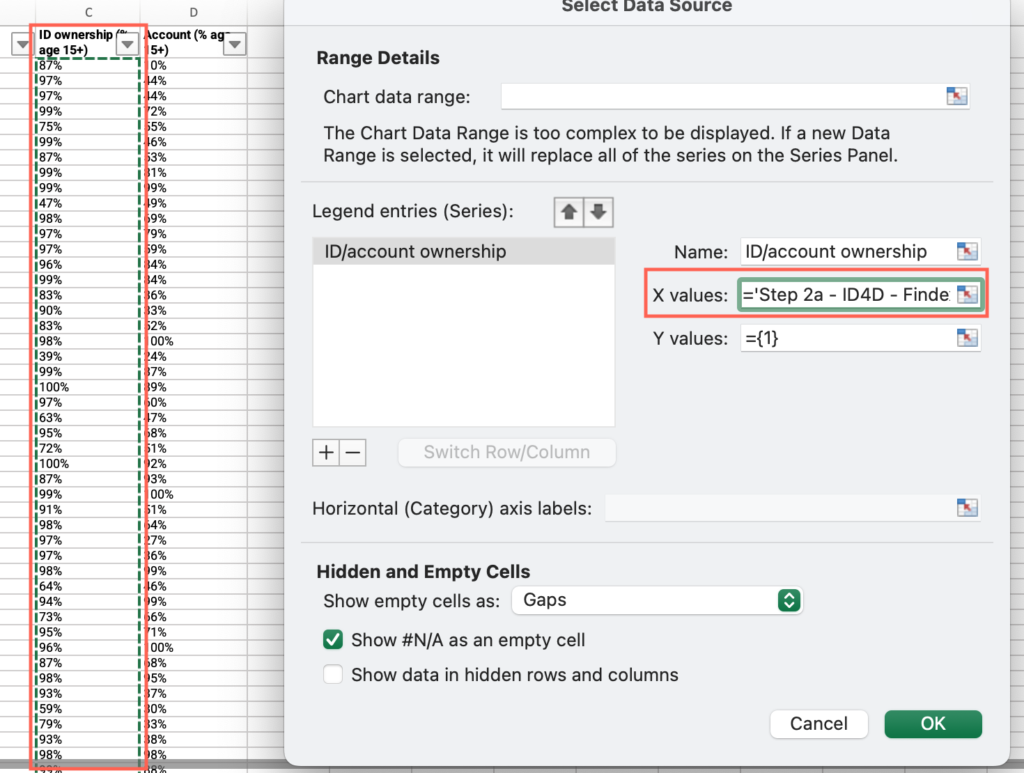
- Click the “Y Values” field > Select all cells under the “Account (% age 15+)” column. Press “OK.”
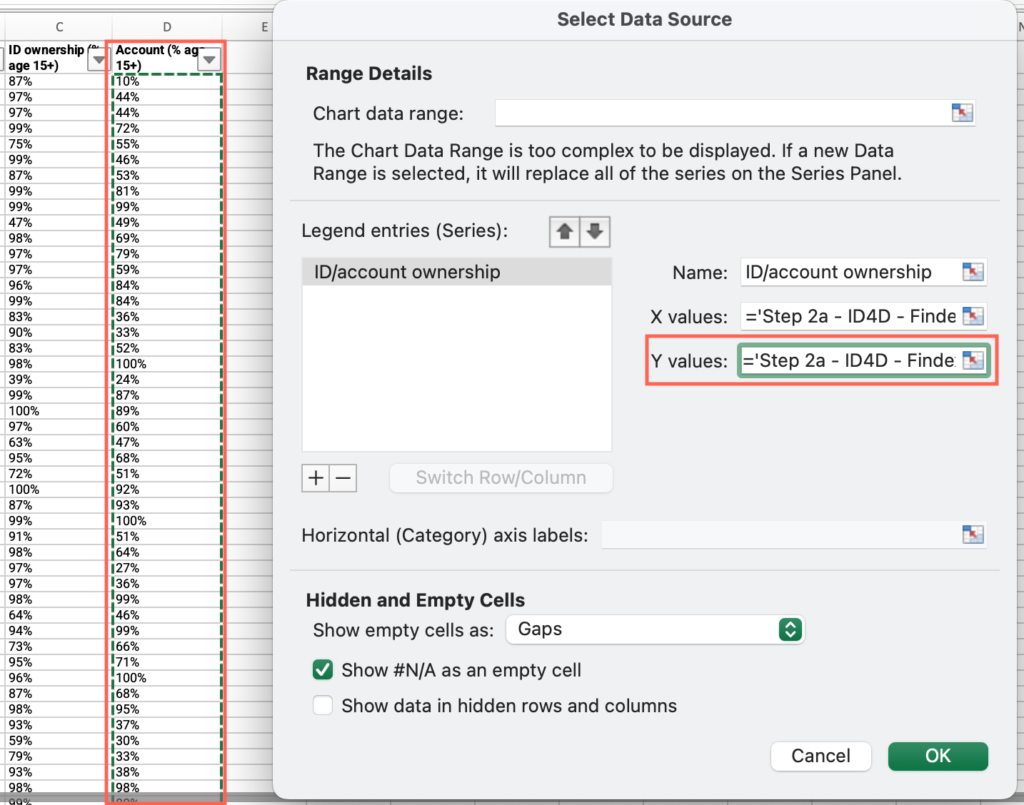
- Right click on one of the data points > select “Add data label.”
- Right click on one of the data points > select “Format data label.”
- Under “Label contains” check “Value from cells” > Select all cells with values under the “Country” column > Press OK.
- Uncheck “Y value” >Analyze the output and answer the question on the platform.
Step 2b: Is there a National digital identity system/ program in place in your country?
- Open the “Step 2b – ITU” sheet > Locate the “Country” column > Filter by your country.
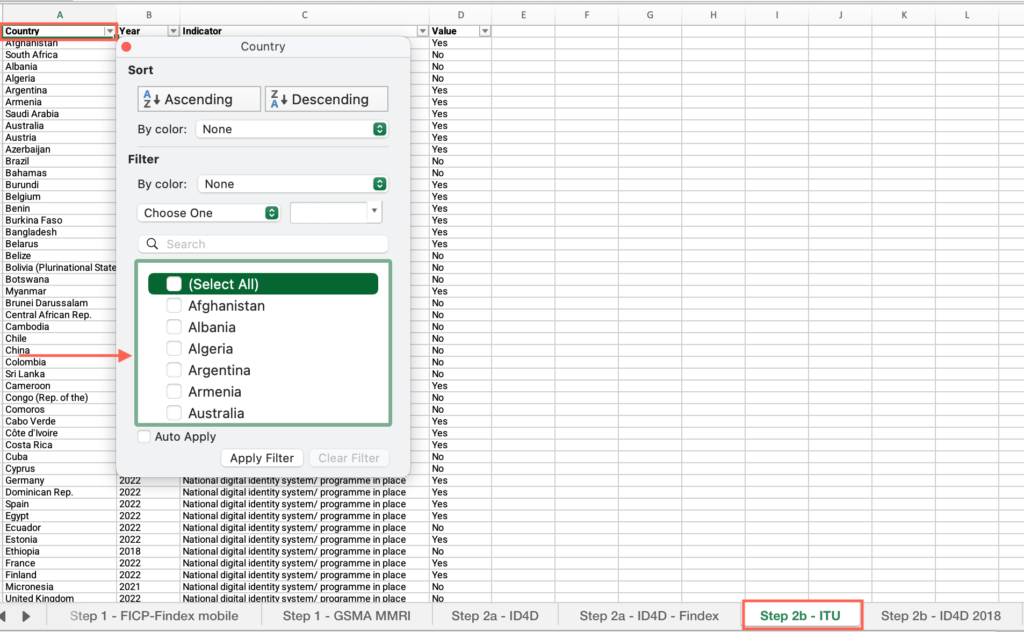
- Locate the “Value” column > Find your country’s value and answer the question on the platform.

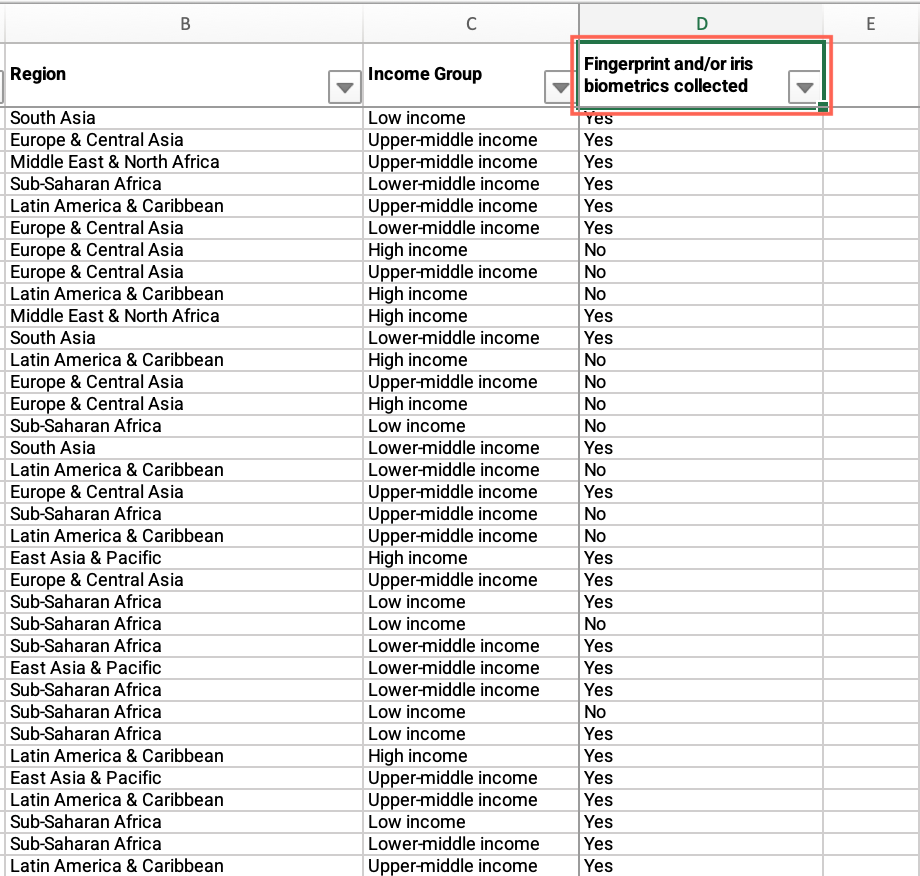
Step 2b: Does your country collect biometrics for the national ID system?
- Open the “Step 2b – ID4D 2018” sheet > Locate the “Country” column > Filter by your country.
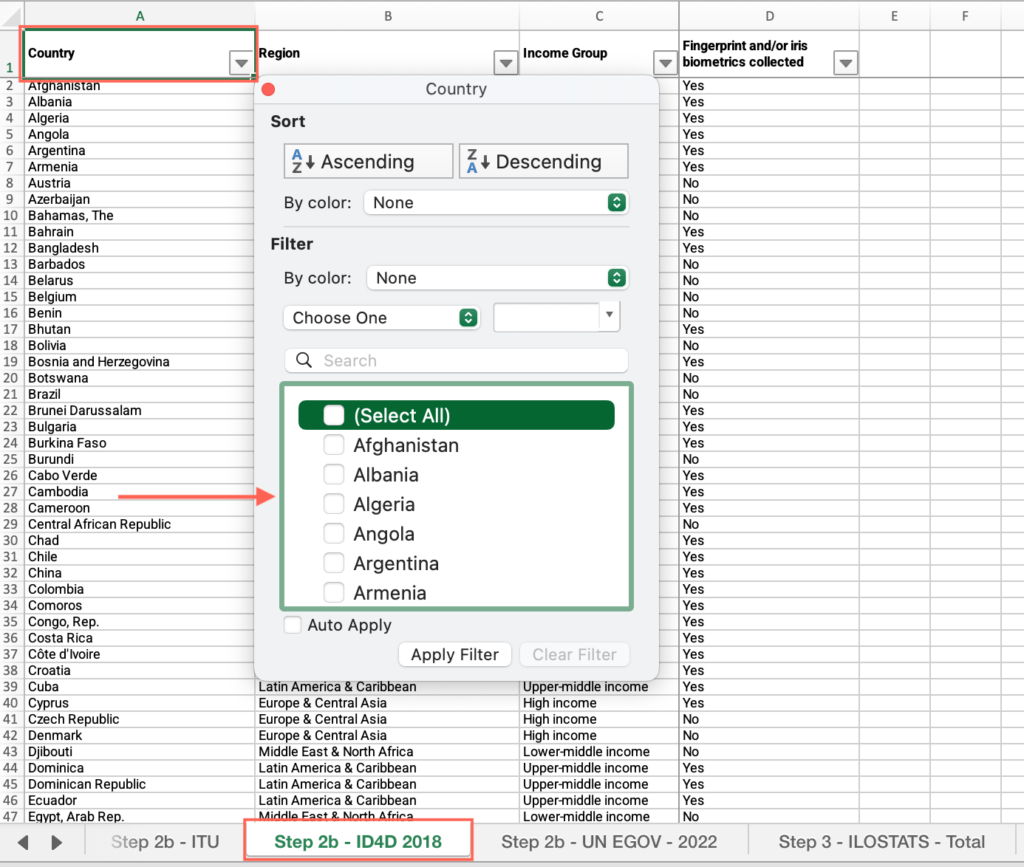
- Locate the “Fingerprint and/or iris biometrics collected” column > Find your country’s value and answer the question on the platform.
Step 2b: How does your country score in the E-Government Development Index (EGDI)?
- Open the “Step 2b – UN EGOV – 2022” sheet > Locate the “Country” column > Filter by your country.
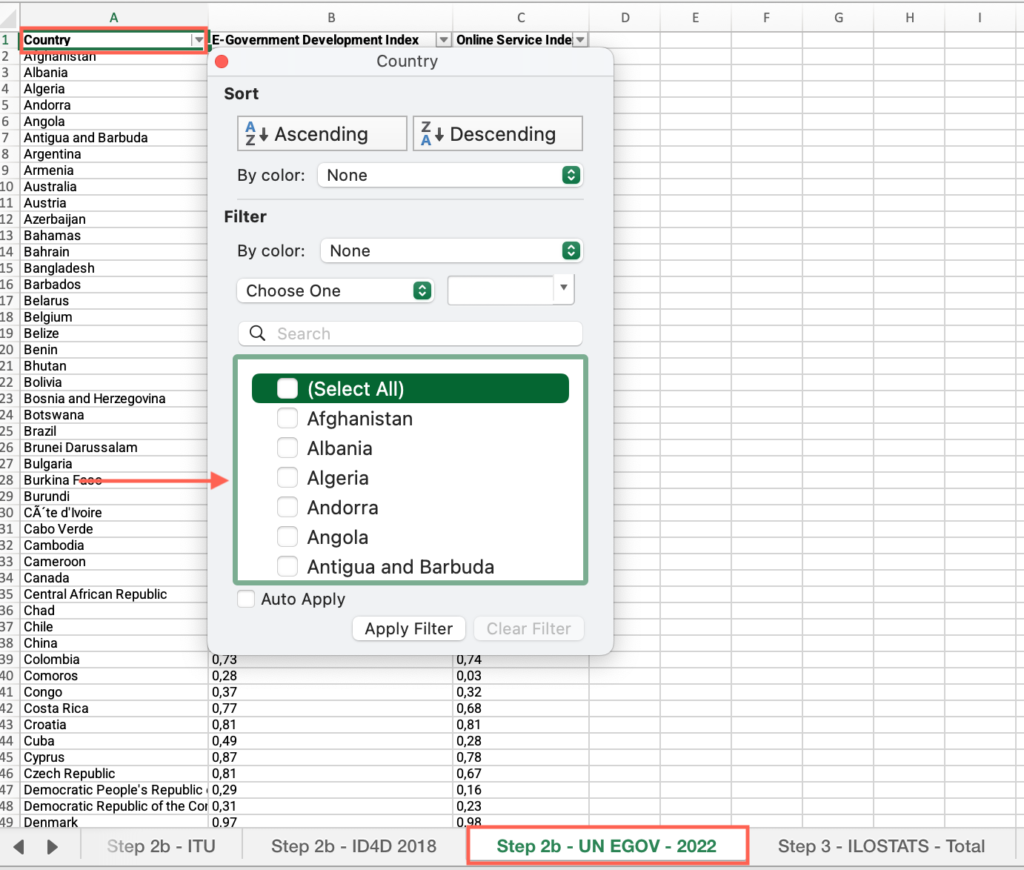
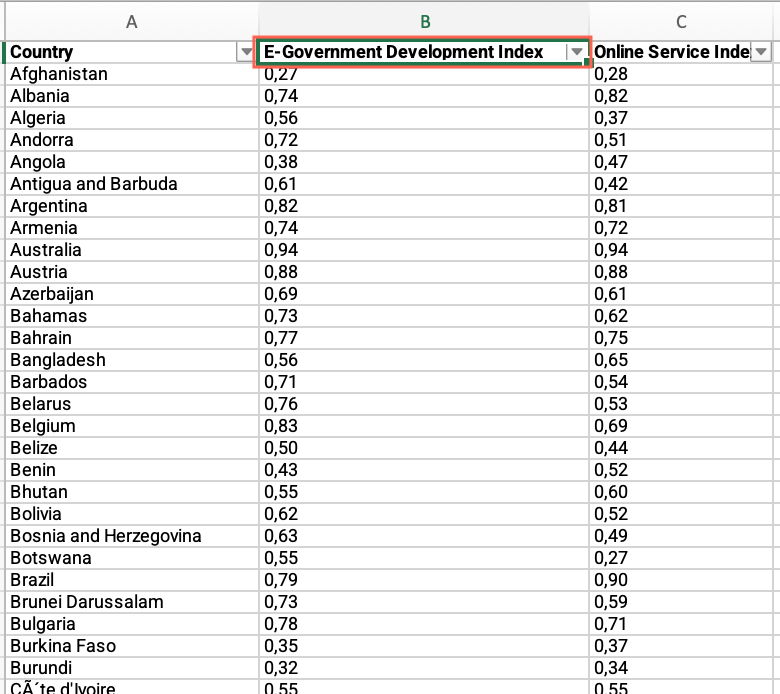
- Locate the “E-Government Development Index” column > Find your country’s value and answer the question on the platform.
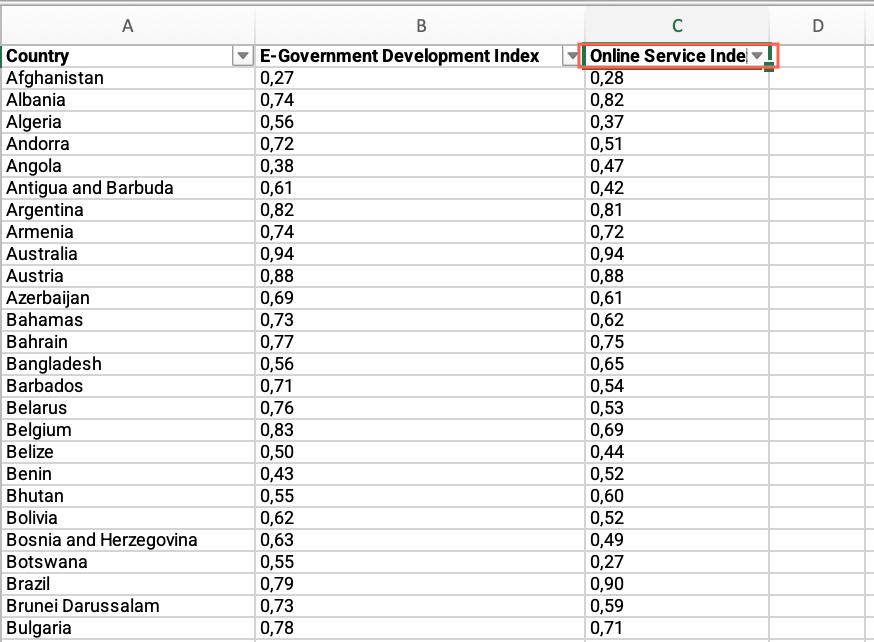
Step 2b: How does your country score in the Online Service Index?
- In the “Step 2b – UN EGOV – 2022” sheet, locate the “Country” column > Filter by your country.
- Locate the Online Service Index” column > Find your country’s value and answer the question on the platform.
Step 3: Simplified requirements graph
- Open the “Step 3 – Simplified requirement” sheet > Locate an empty cell outside the data range, not associated with any row or column containing data > Click on the empty cell.
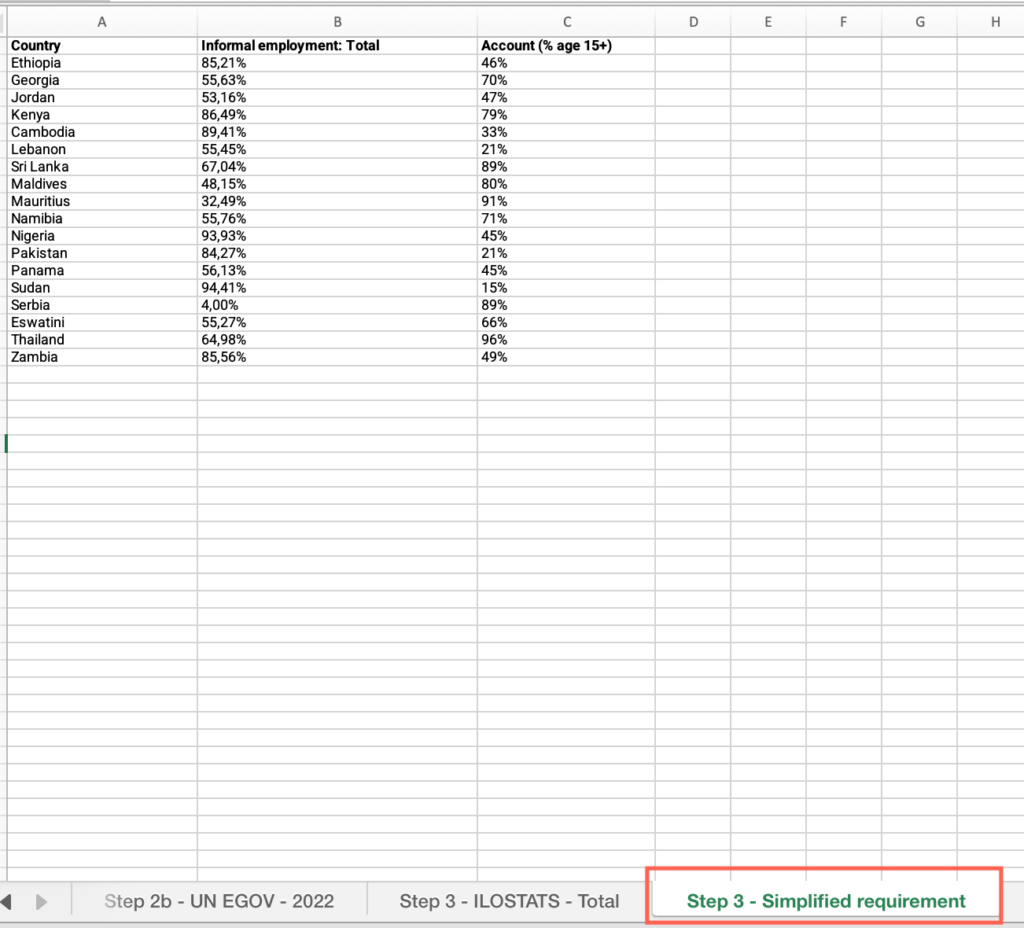
- Click the Insert menu > Locate the charts icons > click the Scatter plot icon > select “Scatter.”
- Click on the chart area > Click the Chart Design menu > click “Select data.”
- Make sure the “Show data in hidden rows and columns” checkbox from the “Hidden and Empty Cells” options is unmarked.
- Click on the + sign to add a series > In the “Name” field, type “Informality/Simplified requirements/Account ownership.”
- Click the “X Values” field > Select all cells under the “Informal Employment – Total” column.
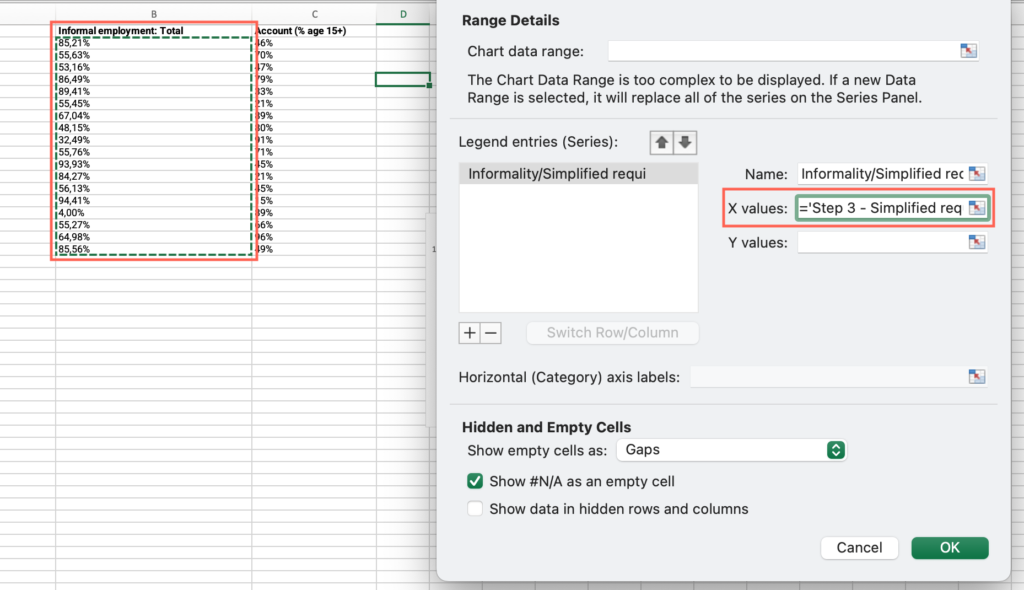
- Click the “Y Values” field > Select all cells under the “Account (% age 15+)” column. Press “OK.”
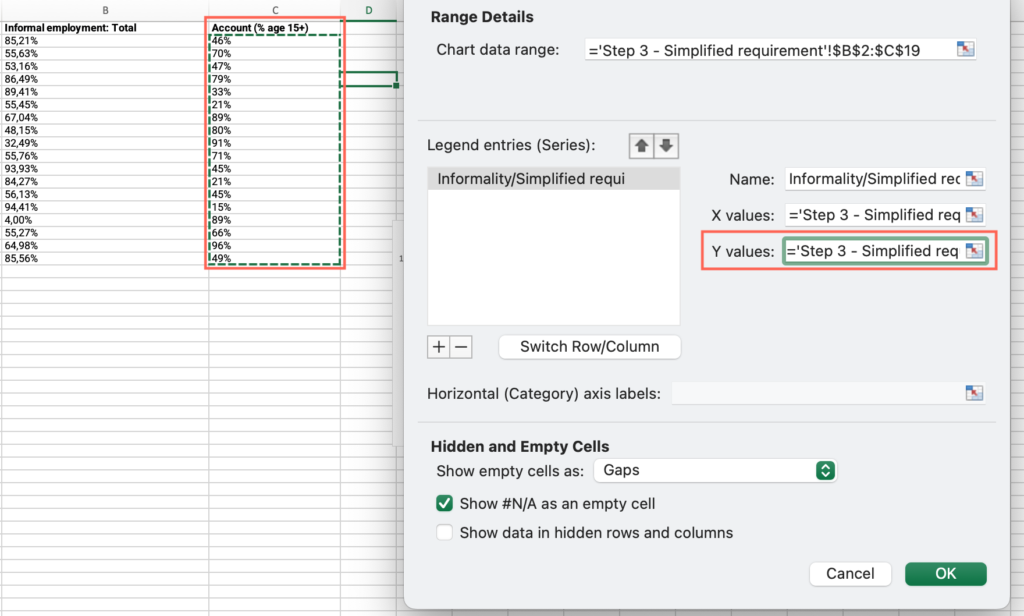
- Right click on one of the data points > select “Add data label.”
- Right click on one of the data points > select “Format data label.”
- Under “Label contains” check “Value from cells” > Select all cells with values under the “Country” column > Press OK.
- Uncheck “Y value” >Analyze the output and answer the question on the platform.
Step 3: Stricter requirements graph
- Open the “Step 3 – Stricter requirements” sheet > Locate an empty cell outside the data range, not associated with any row or column containing data > Click on the empty cell.
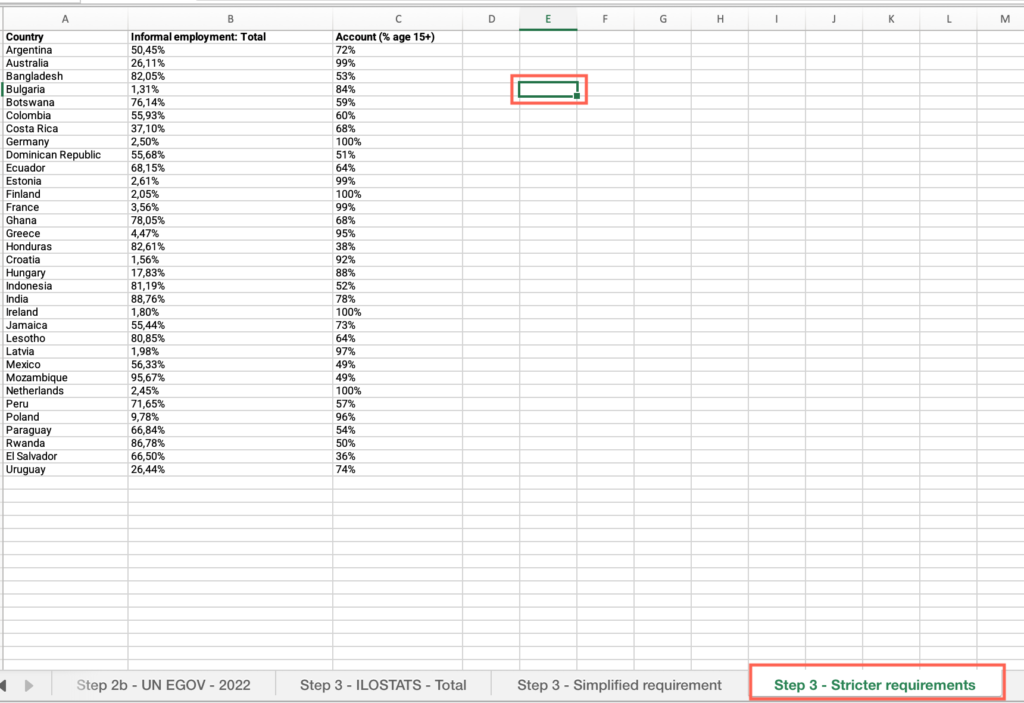
- Click the Insert menu > Locate the charts icons > click the Scatter plot icon > select “Scatter.”
- Click on the chart area > Click the Chart Design menu > click “Select data.”
- Make sure the “Show data in hidden rows and columns” checkbox from the “Hidden and Empty Cells” options is unmarked.
- Click on the + sign to add a series > In the “Name” field, type “Informality/Stricter requirements/Account ownership.”
- Click the “X Values” field > Select all cells under the “Informal Employment – Total” column.
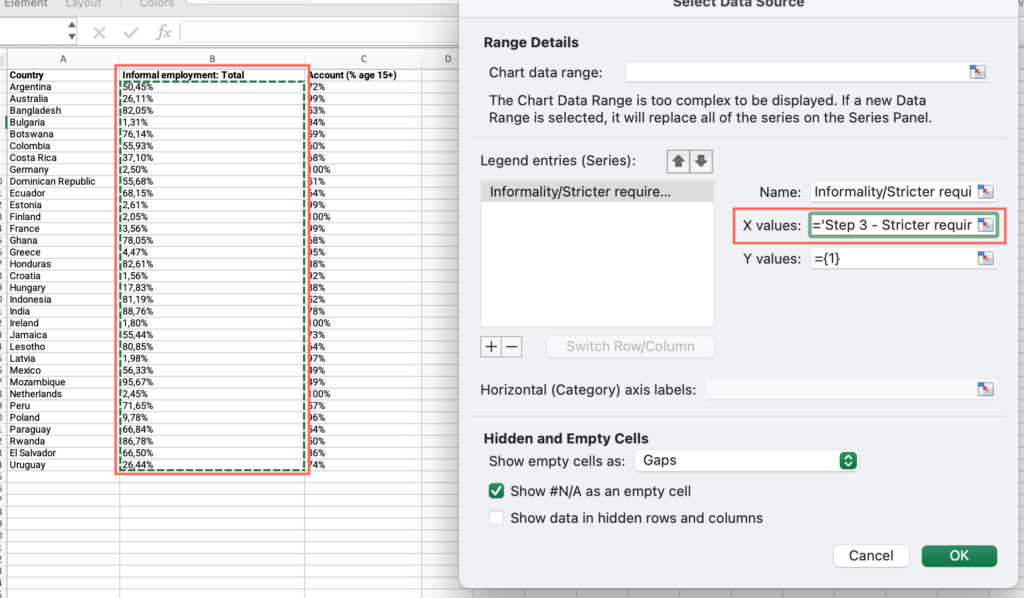
- Click the “Y Values” field > Select all cells under the “Account (% age 15+)” column. Press “OK.”
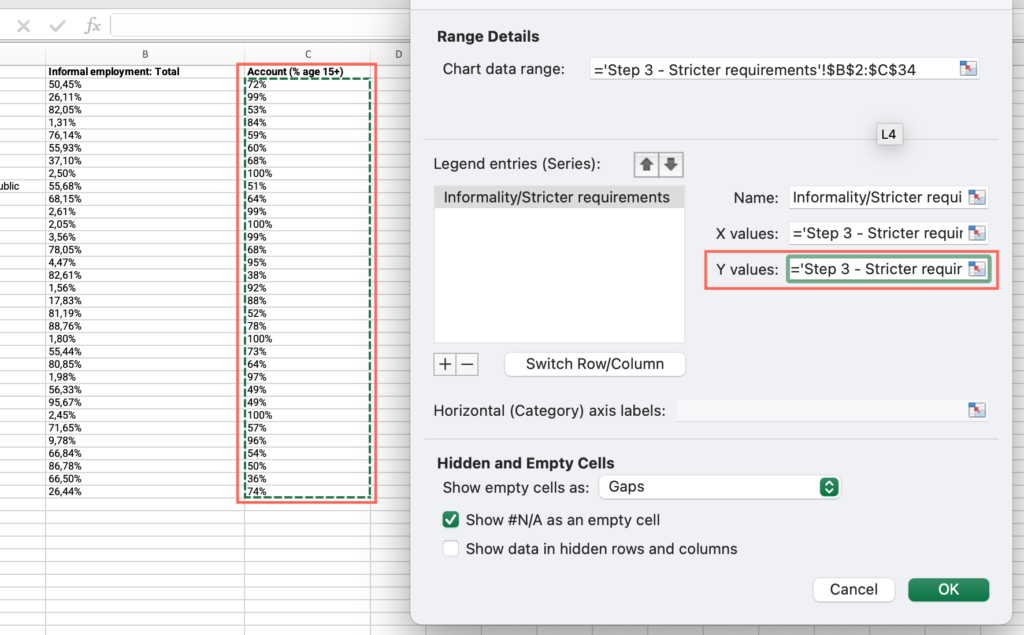
- Right click on one of the data points > select “Add data label.”
- Right click on one of the data points > select “Format data label.”
- Under “Label contains” check “Value from cells” > Select all cells with values under the “Country” column > Press OK.
- Uncheck “Y value” >Analyze the output and answer the question on the platform.
Step 3: Is your country’s female informal employment rate above the global average?
- Open the “Step 3 – ILOSTATS – female” sheet, locate the “Country” column > Filter by your country.
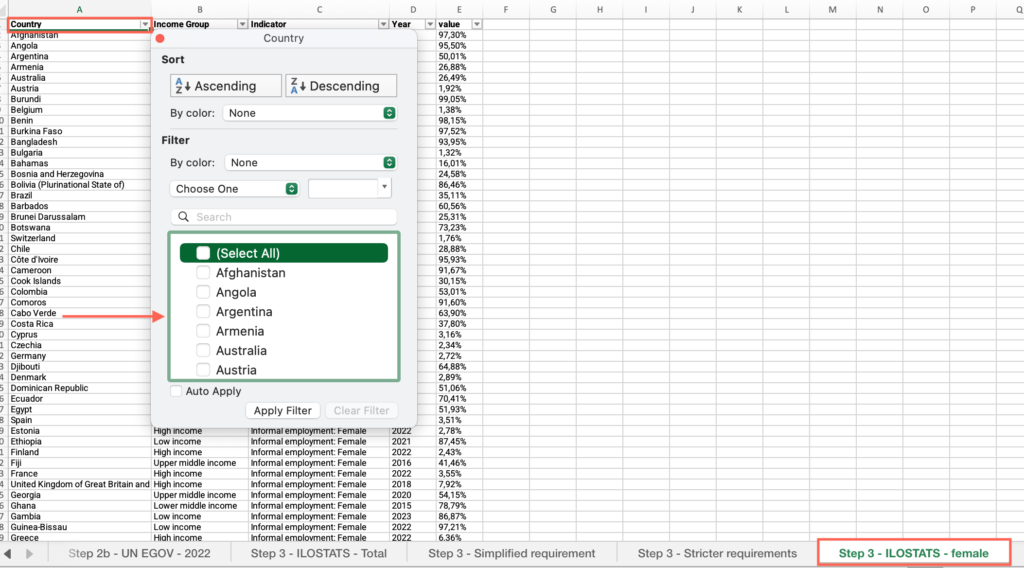
- Locate the “Value” column > Find your country’s value.
- Locate the “Country” column > Apply the filter > Check “Select all.”
- Locate the “Value” column > Click and drag to select the entire range of cells under this column > Find the average at the bottom of the sheet, compare it with your country’s value and answer the question on the platform.
Step 3: Is your country’s female informal employment rate above your income group average?
- In the “Step 3 – ILOSTATS – female” sheet, locate the “Country” column > Filter by your country.
- Locate the “Value” column > Find your country’s value.
- Locate the “Country” column > Apply the filter > Check “Select all.”
- Locate the “Income group” column > Filter by your income group.
- Locate the “Value” column > Click and drag to select the entire range of cells under this column > Find the average at the bottom of the sheet, compare it with your country’s value and answer the question on the platform.
