Module 9 Assignment – Excel Tutorials
The following tutorial is an optional resource meant to assist you in navigating the databases and collecting the necessary data for your analysis.
Note on recording your responses: In the assignment you will find all the necessary fields to record your answers and the data you collect. You will also find an optional Answer Sheet Excel file to keep record of the collected data and your findings. You will find this file in the assignment’s introduction.
Step 1: Is your country’s ratio of adult literacy less than 95 percent?
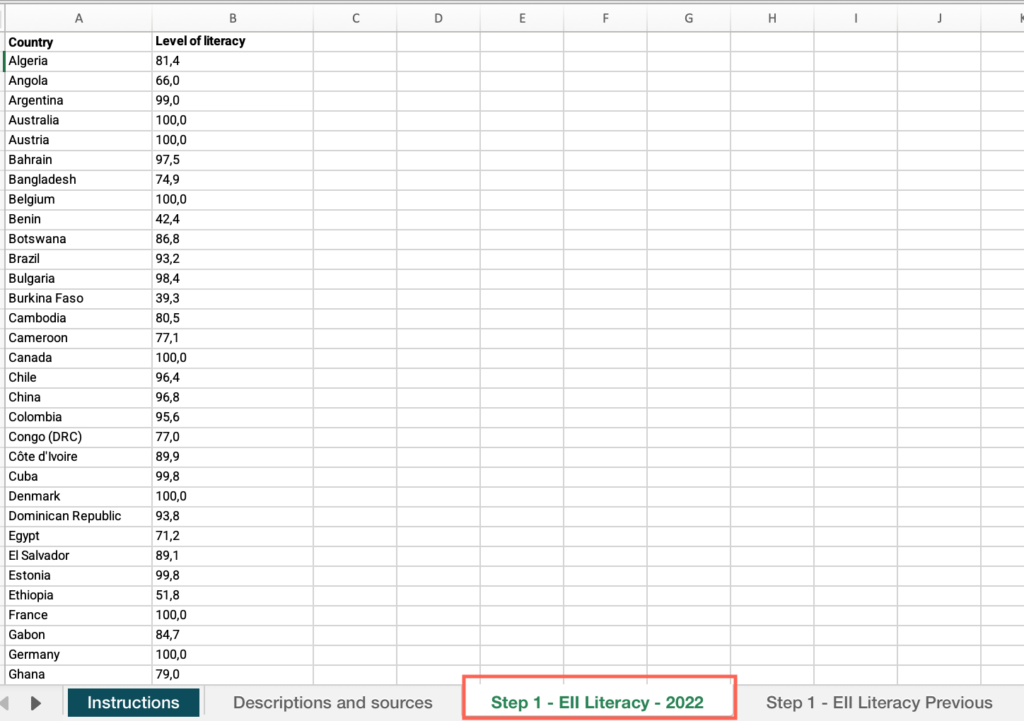
- Open the “M9 – Step-by-step guide to analyze lack of financial or technical literacy – databases.xlsx” file > Open the “Step 1 – EII Literacy – 2022” sheet.
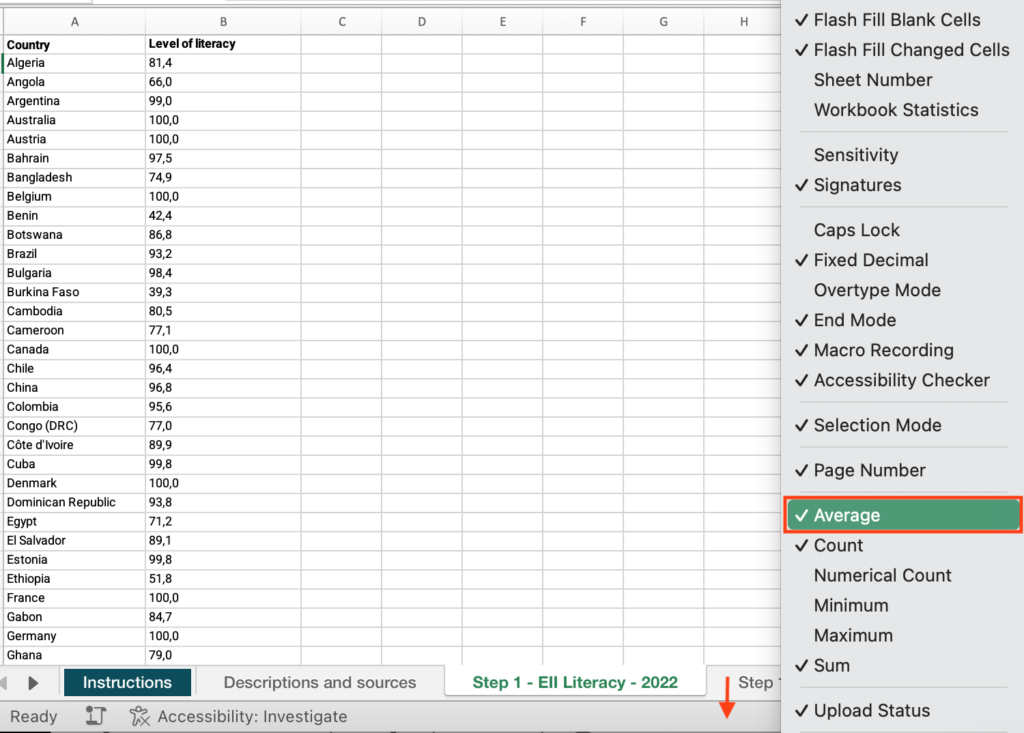
- Right-click on the status bar at the bottom of the Excel window > In the dialog box that appears, ensure that the checkbox for “Average” is checked.
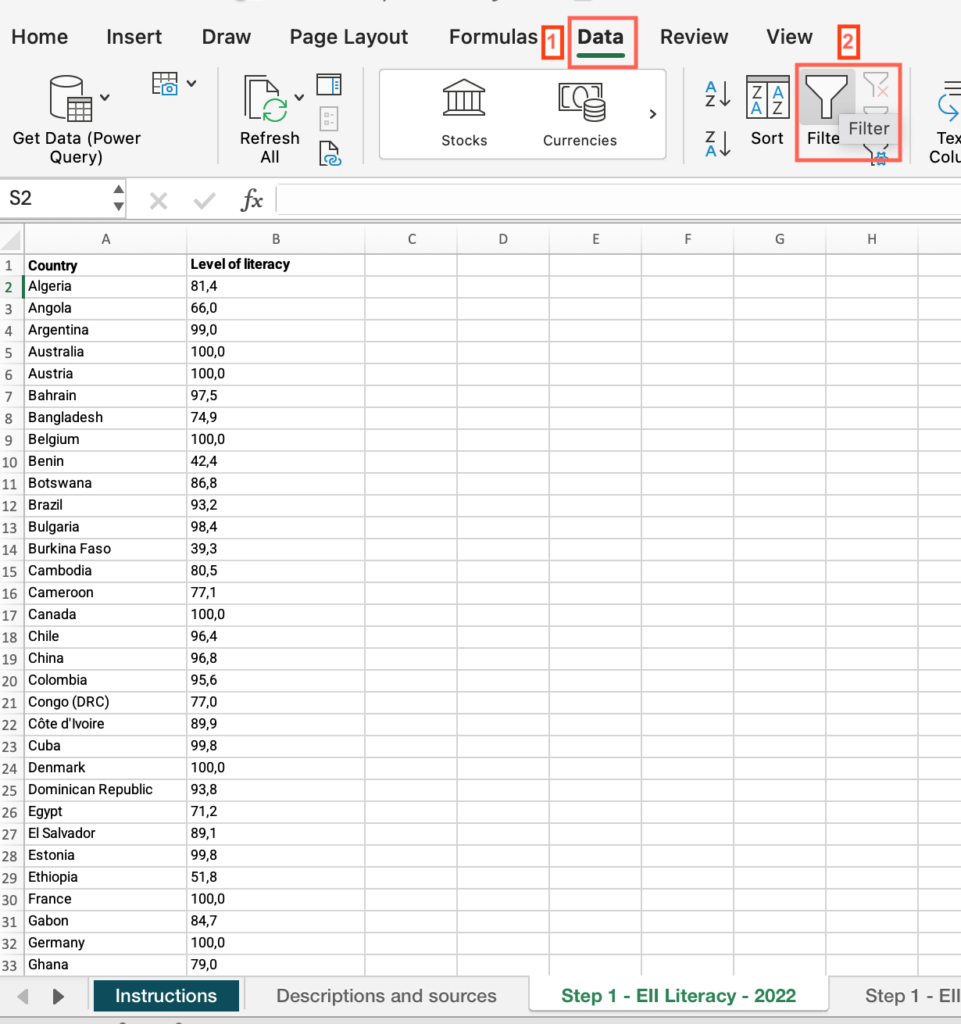
- Select the header row > click the Data menu > Select “Filter”.
- Now that “Filter” is enabled, click on the dropdown arrow in the “Country” column header > Uncheck “Select All” > Check the box for your country.
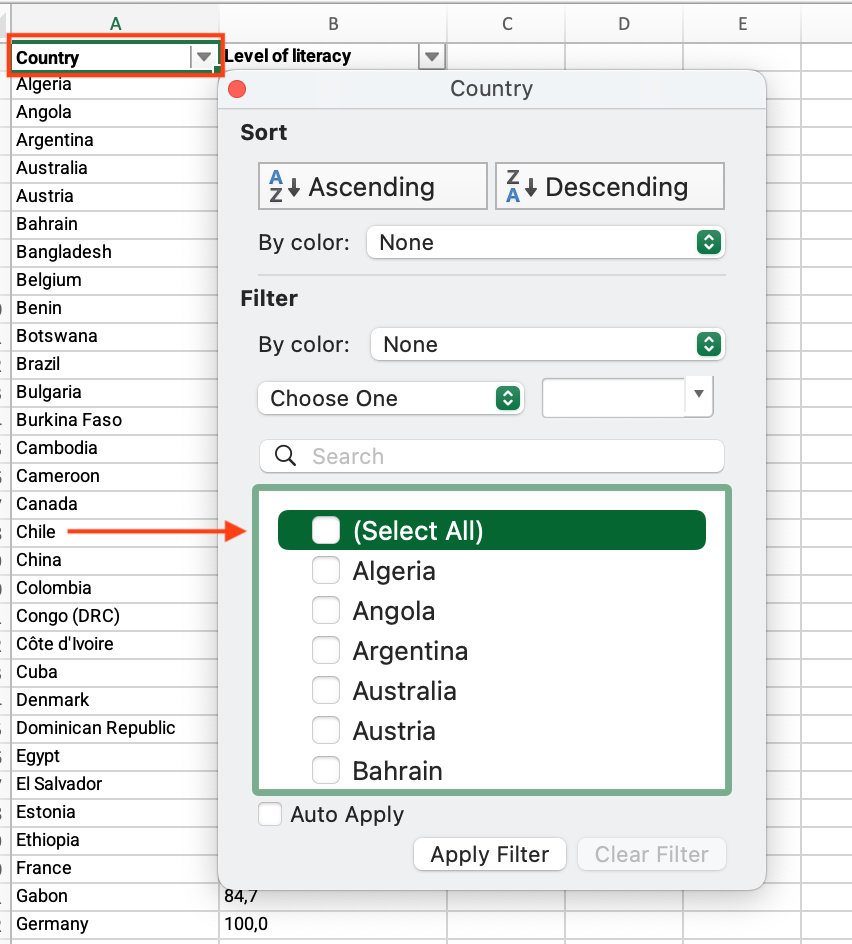
- Locate the “Level of literacy” column > Find the value and answer the question on the platform.
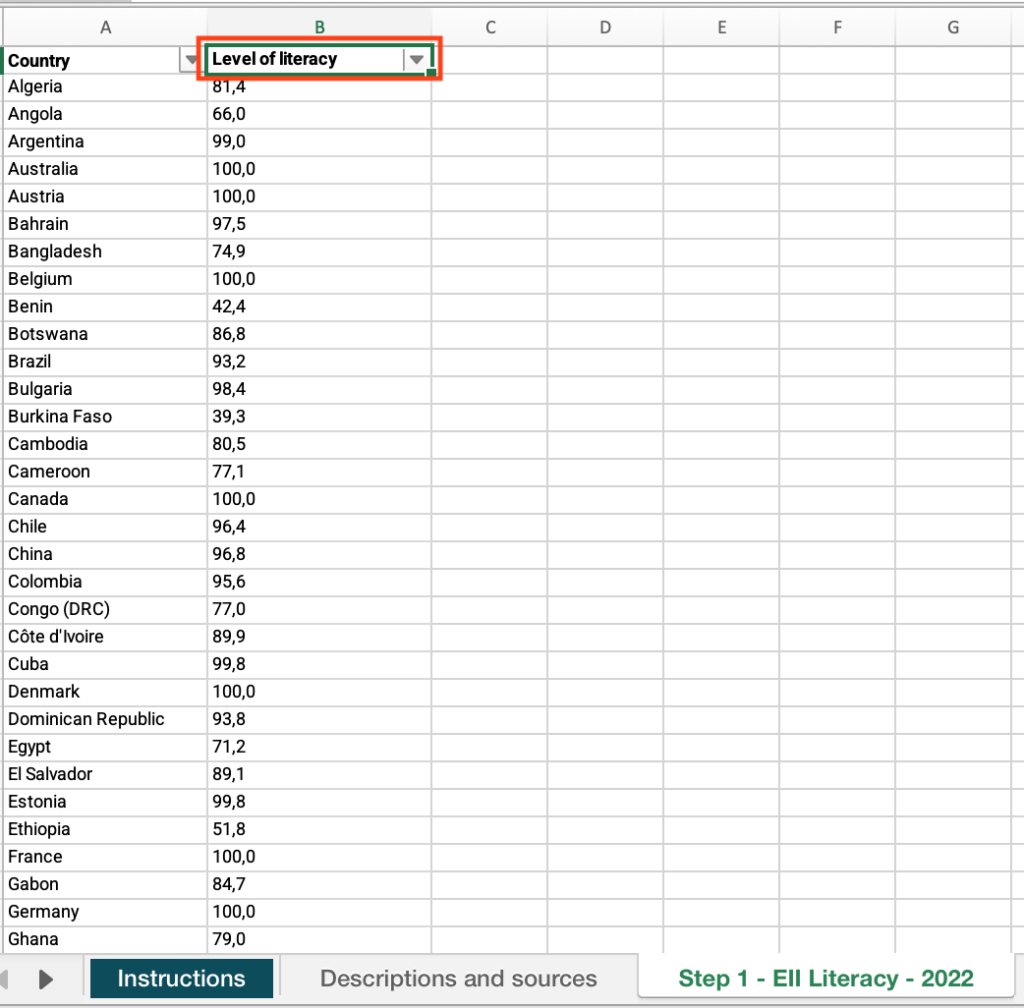
Step 1: Check the data from previous editions (years). Has there been an improvement over the years?
- Open the “Step 1 – EII Literacy Previous” sheet.
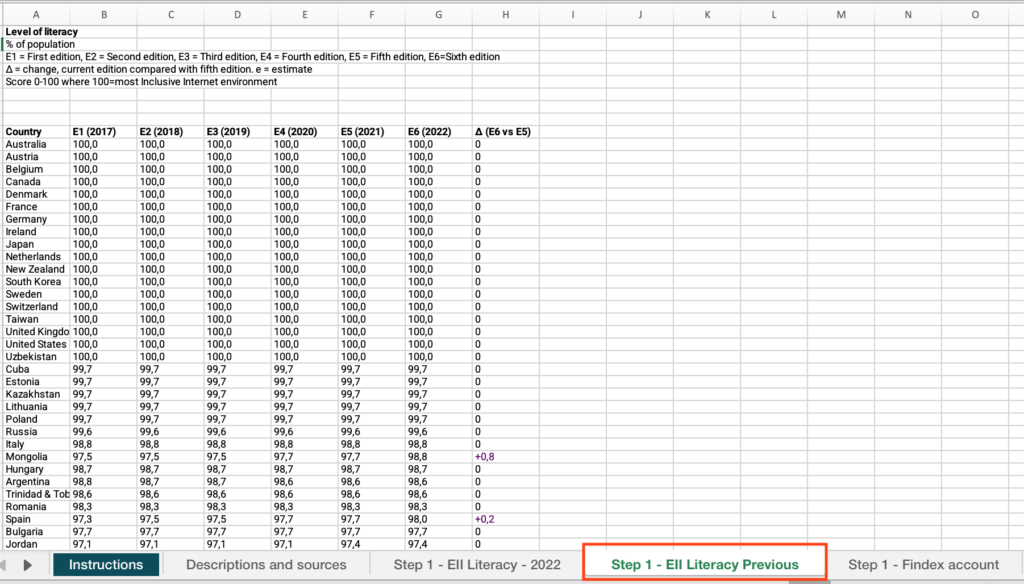
- Locate the “Country” column > Filter by your country.
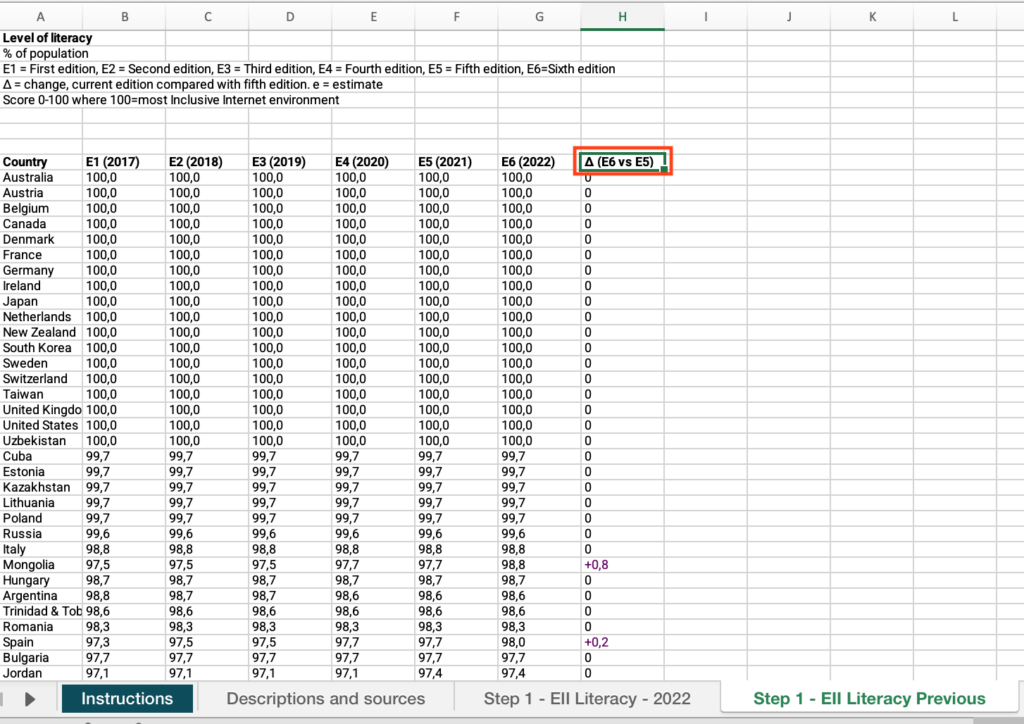
- Locate the “Δ (E6 vs E5)” column > Find the value and answer the question on the platform.
Step 1: Which combination best represents your country?
- Open the “Step 1 – Findex account” sheet.
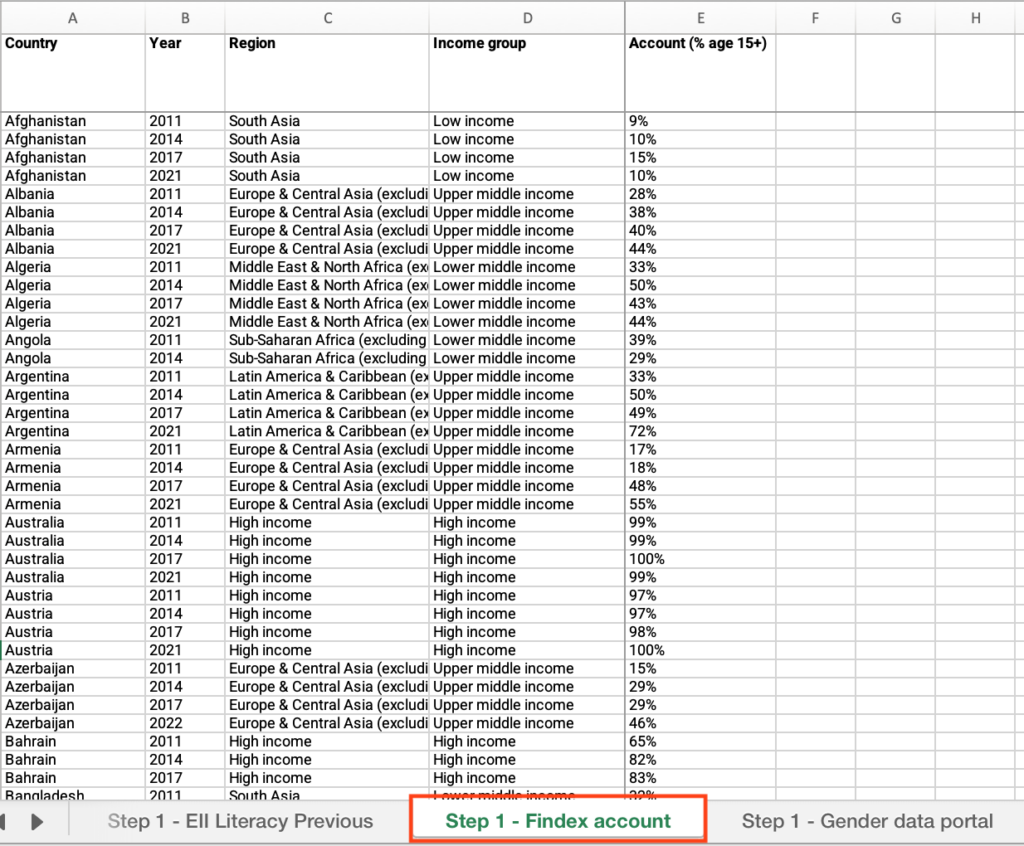
- Locate the “Country” column > Filter by your country.
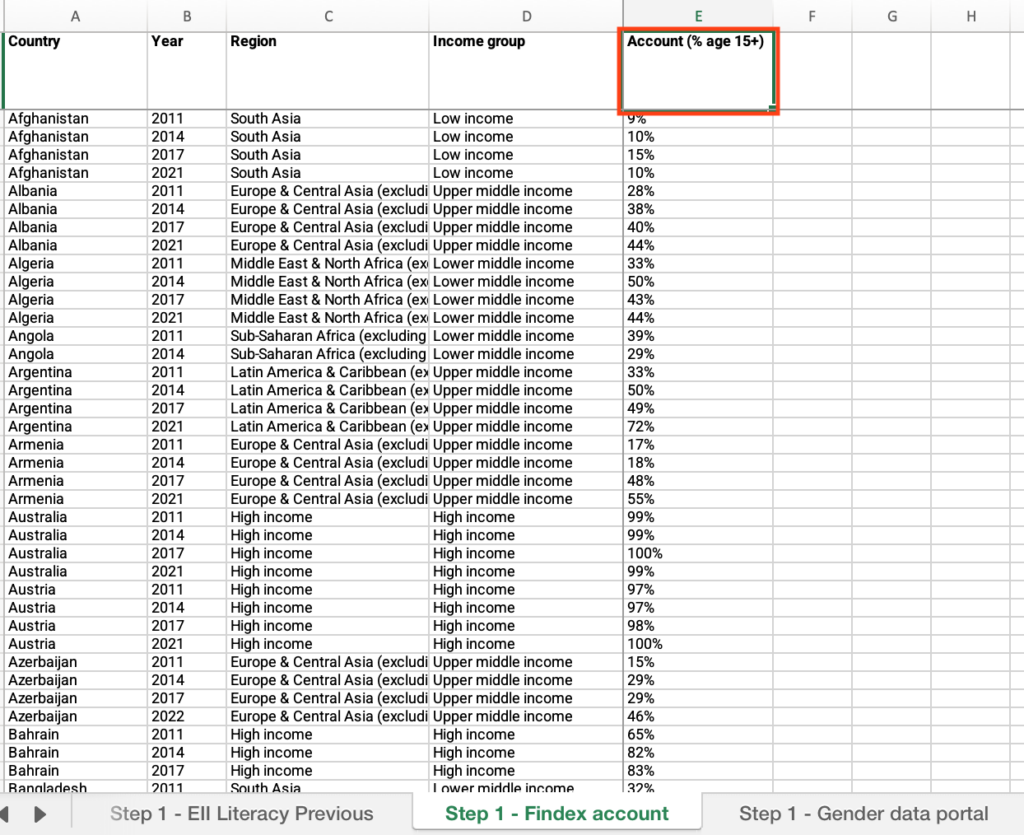
- Locate the “Account (% age 15+)” column > Find the value and answer the question on the platform.
Step 1: Is your country’s gender gap in literacy rates above the average for non-high-income countries?
- Open the “Step 1 – Gender data portal” sheet.
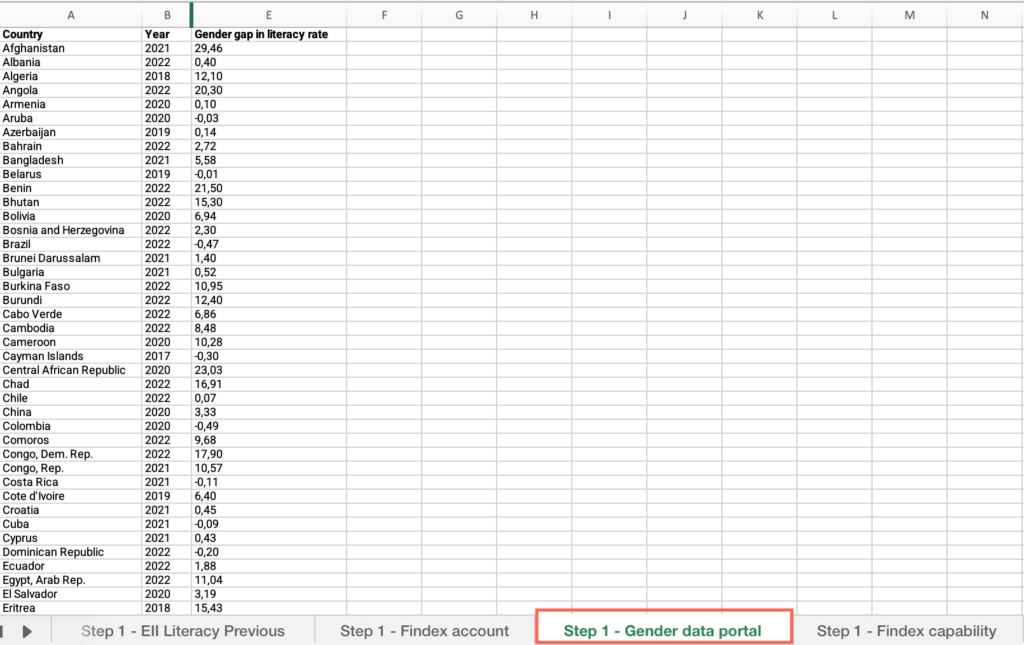
- Locate the “Country” column > Filter by your country.
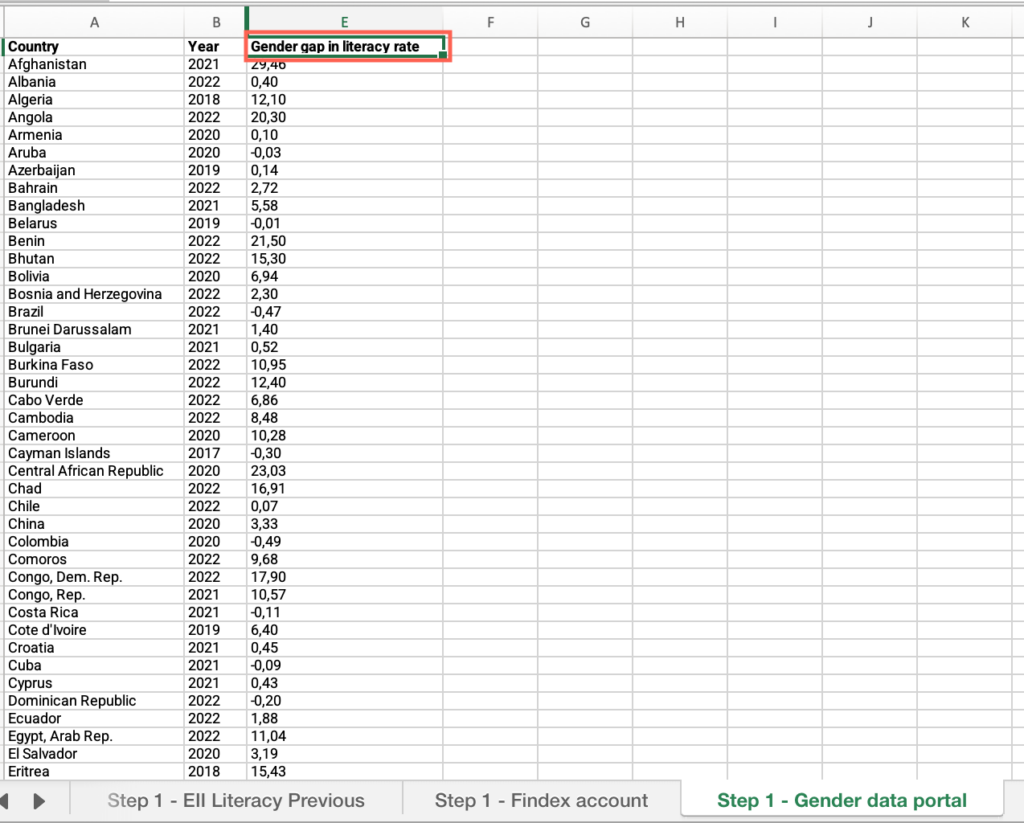
- Locate the “Gender gap in literacy rate” column > Find the value.
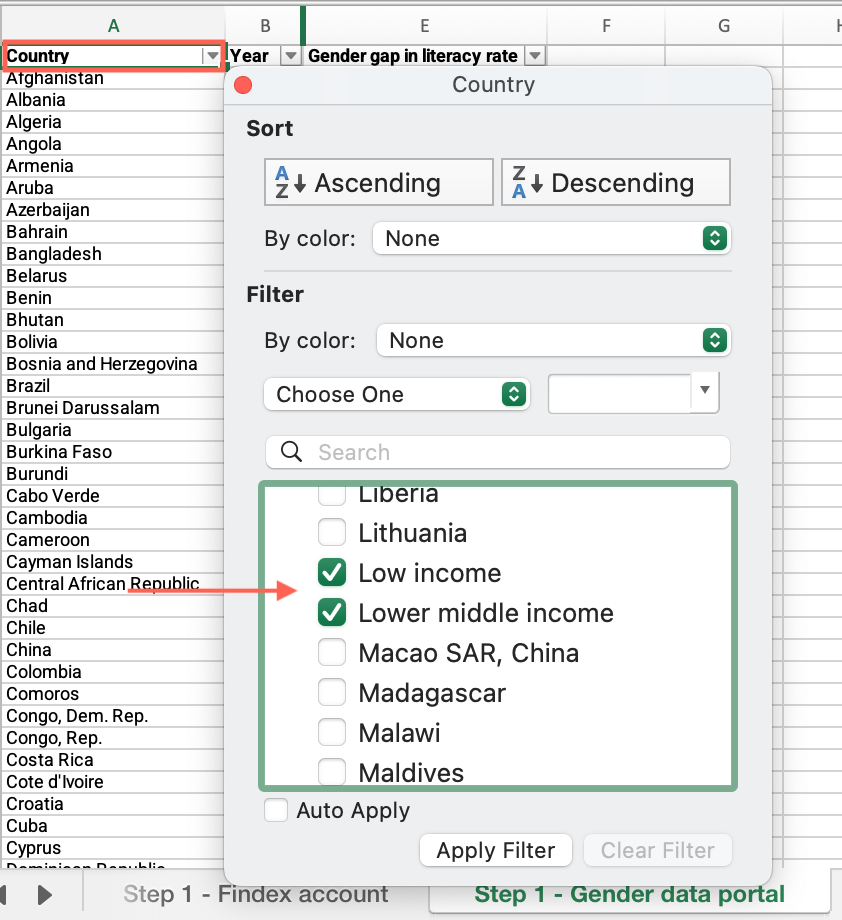
- Locate the “Country” column > Apply the filter > Uncheck “Select all” > Check the boxes next to “Low income” ”Lower-middle income” and Upper-Middle income”
- Locate the “Gender gap in literacy rate” column > Click and drag to select the entire range of cells under this column > See the average at the bottom of the sheet.
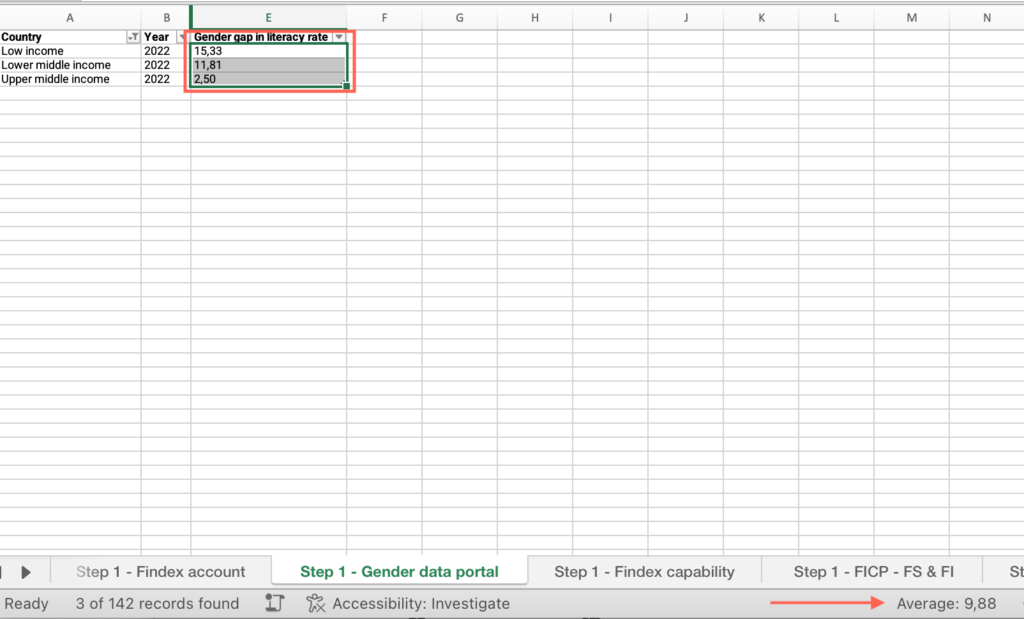
- Compare your country’s value with the average for non-high-income countries and answer the question on the platform.
Step 1: How does your country’s gender gap in literacy rates compare with countries within the same income group?
- In the “Step 1 – Gender data portal” sheet, locate the “Country” column > Uncheck “Select all” > Check the box for your country’s income group.
- Find the value > Compare your country’s value with the average for your country’s income group and answer the question on the platform.
Step 1: Can more than 70 percent of adults in your country use a financial account without any help?
- Open the “Step 1 – Findex capability” sheet.
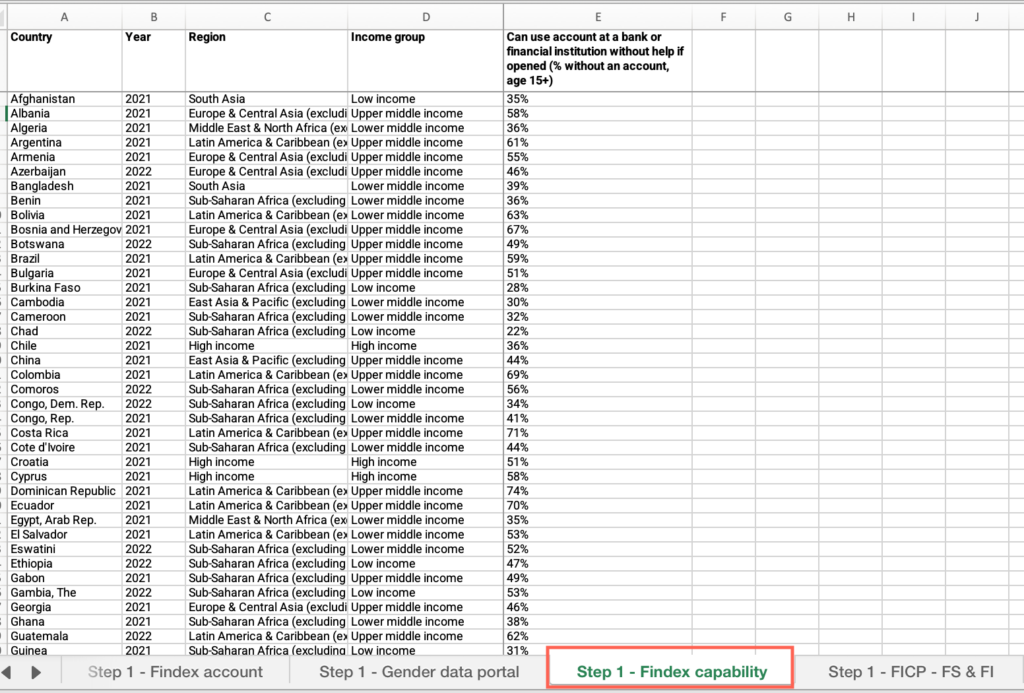
- Locate the “Country” column > Filter by your country.
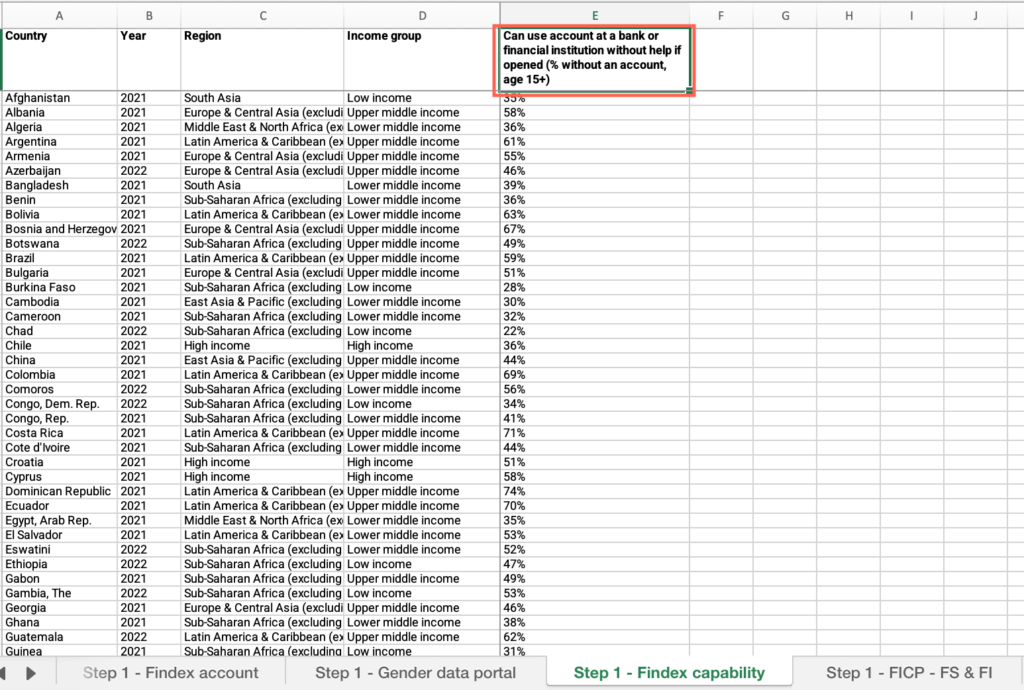
- Locate the “Can use account at a bank or financial institution without help if opened” column > Find the value and answer the question on the platform.
Step 1: Does your country have a National Financial Inclusion Strategy?
- Open the “Step 1 – FICP – FS & FI” sheet.
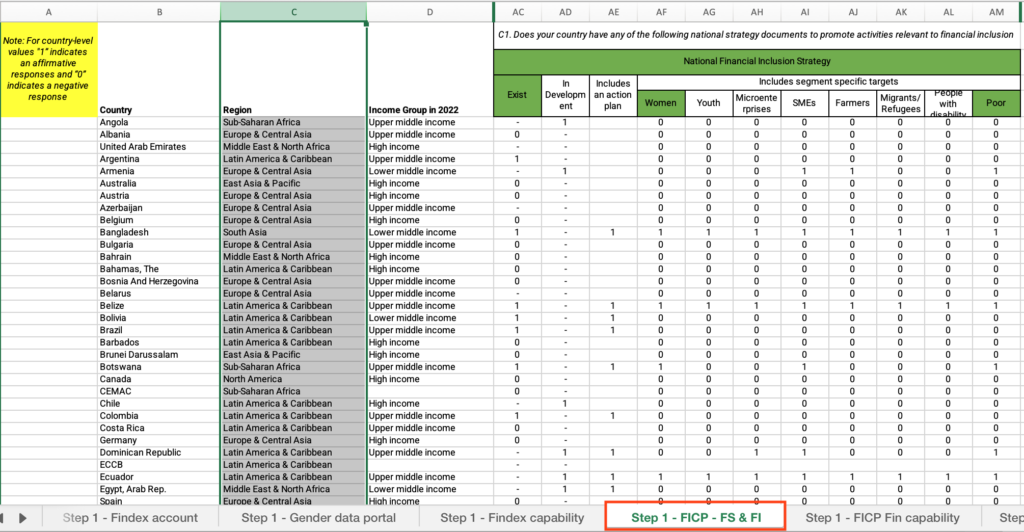
- Locate the “Country” column > Filter by your country.
- Locate the “National Financial Inclusion Strategy – Exist” cell > Find the value and answer the question on the platform.
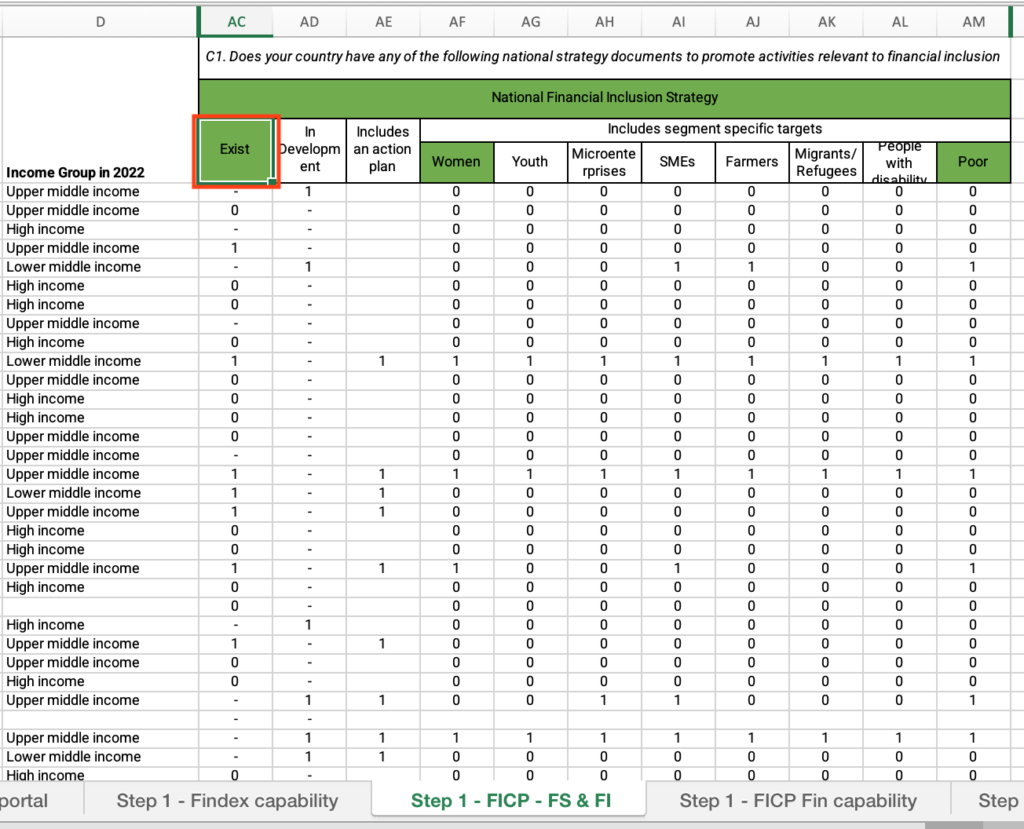
Step 1: Are there differentiated strategies for women?
- In the “Step 1 – FICP – FS & FI” sheet, locate the “Country” column > Filter by your country.
- Locate the “National Financial Inclusion Strategy – Women” cell > Find the value and answer the question on the platform.
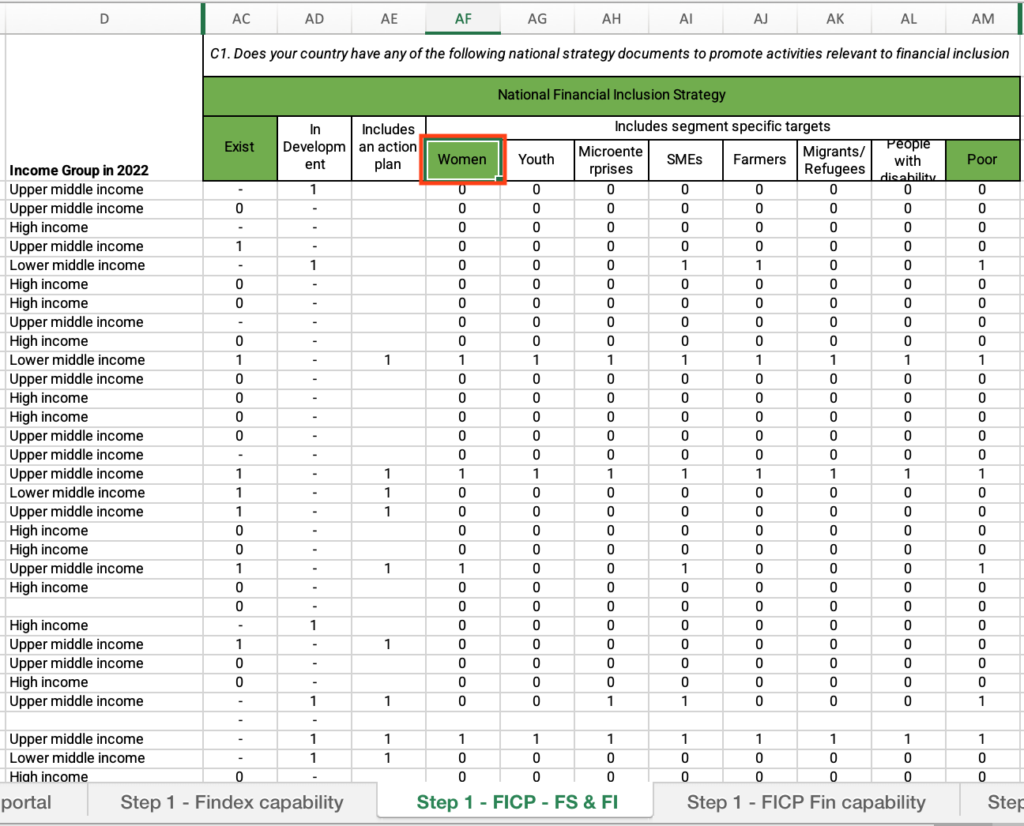
Step 1: Are there differentiated strategies for low-income people?
- In the “Step 1 – FICP – FS & FI” sheet, locate the “Country” column > Filter by your country.
- Locate the “National Financial Inclusion Strategy – Poor” cell > Find the value and answer the question on the platform.
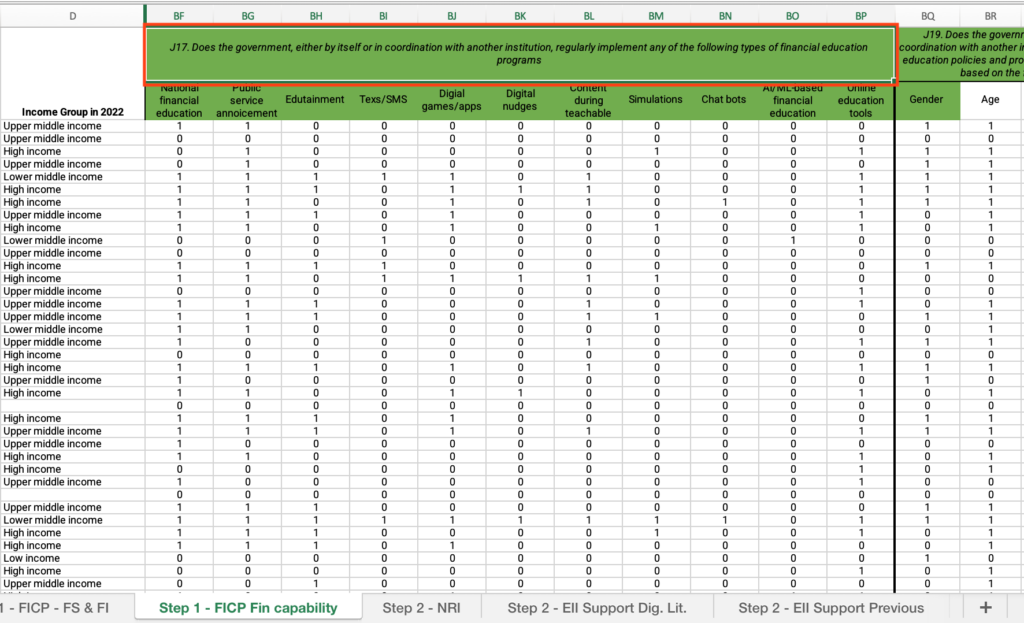
Step 1: Does your country implement any type of financial education program?
- Open the “Step 1 – FICP Fin capability” sheet.
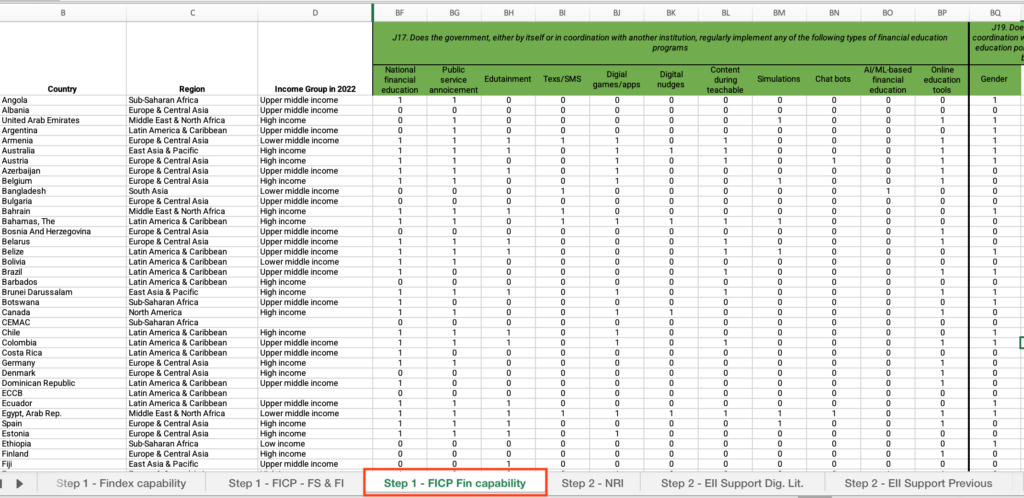
- Locate the “Country” column > Filter by your country.
- Locate the “J17. Does the government, either by itself or in coordination with another institution, regularly implement any of the following types of financial education program” cell > Find the values and answer the question on the platform.
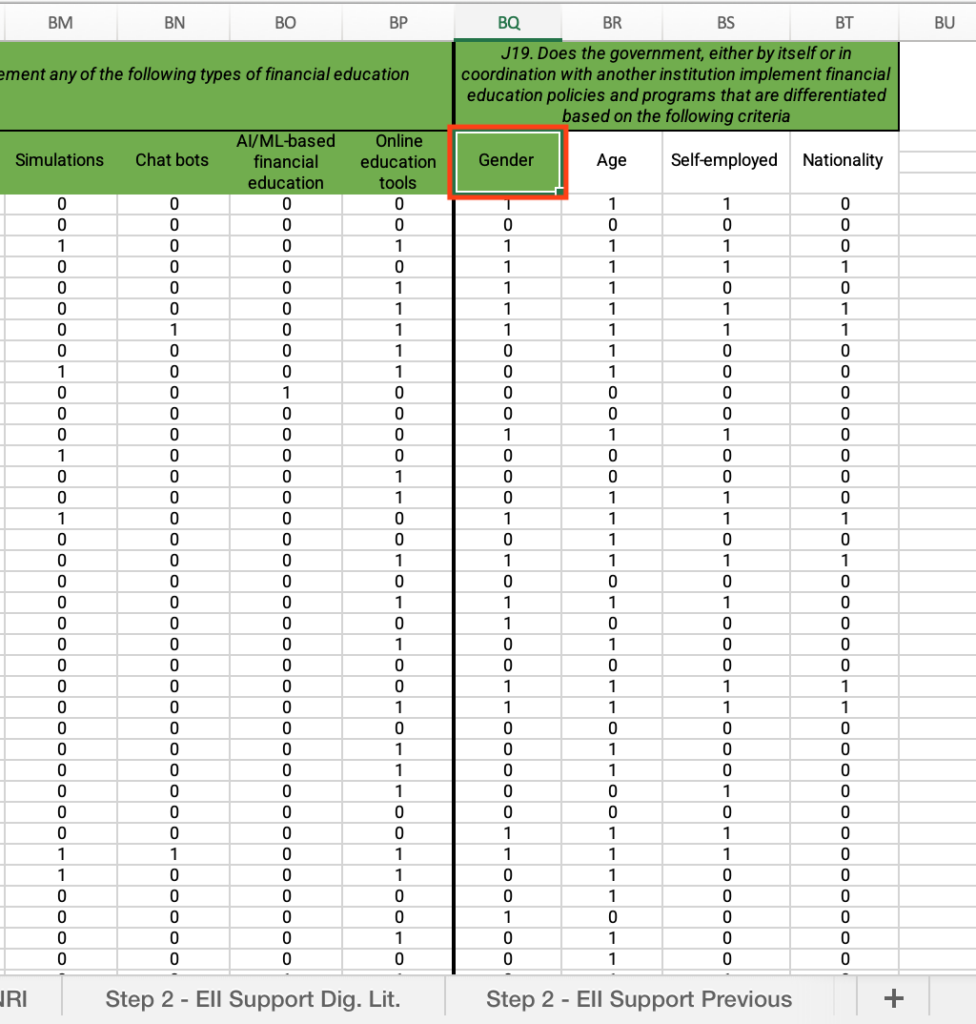
Step 1: Does your country implement financial education policies and programs differentiated by gender?
- Open the “Step 1 – FICP Fin capability” sheet.
- Locate the “Country” column > Filter by your country.
- Below question J19, locate the “Gender” cell > Find the value and answer the question on the platform.
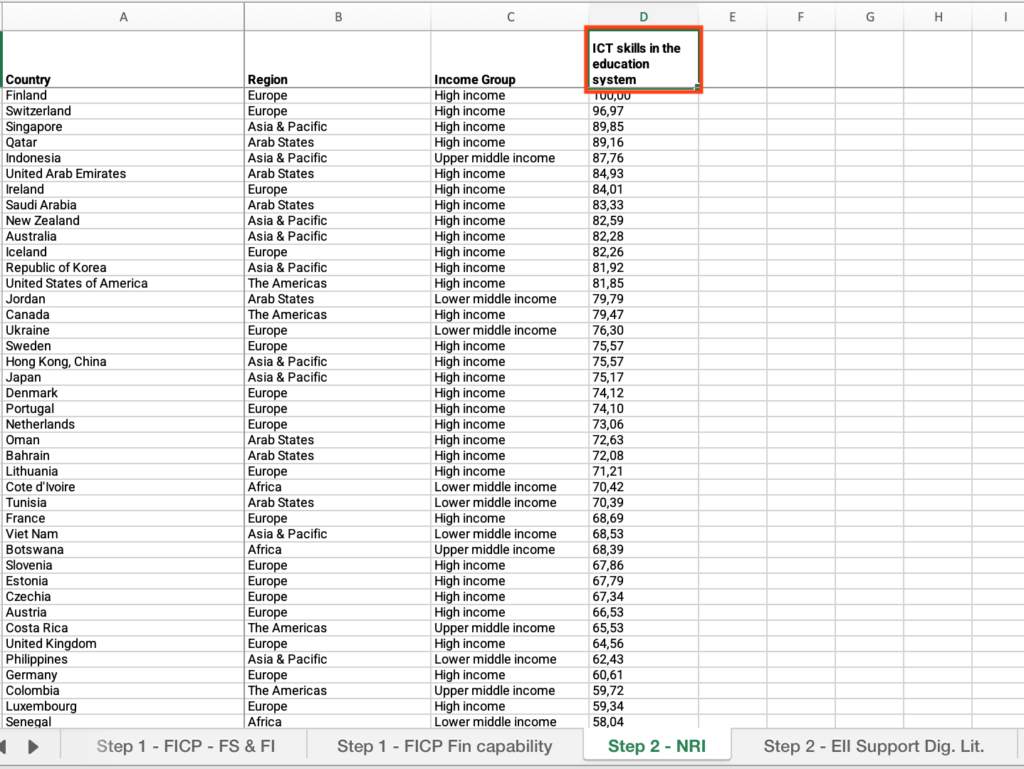
Step 2: Is your country’ score in the ICT skills in the education system indicator below 60?
- Open the “Step 2 – NRI” sheet.
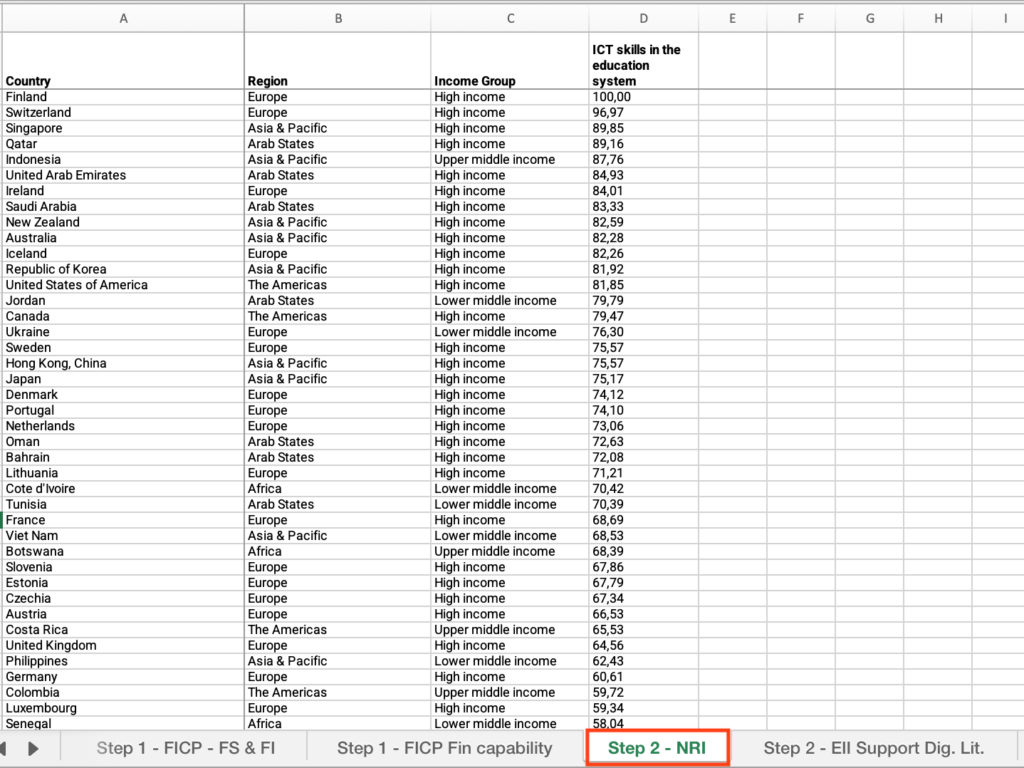
- Locate the “Country” column > Filter by your country.
- Locate the “ICT skills in the education system” column > Find the value and answer the question on the platform.
Step 2: How does your country score in the support for digital literacy indicator?
- Open the “Step 2 – EII Support Dig. Lit.” sheet.
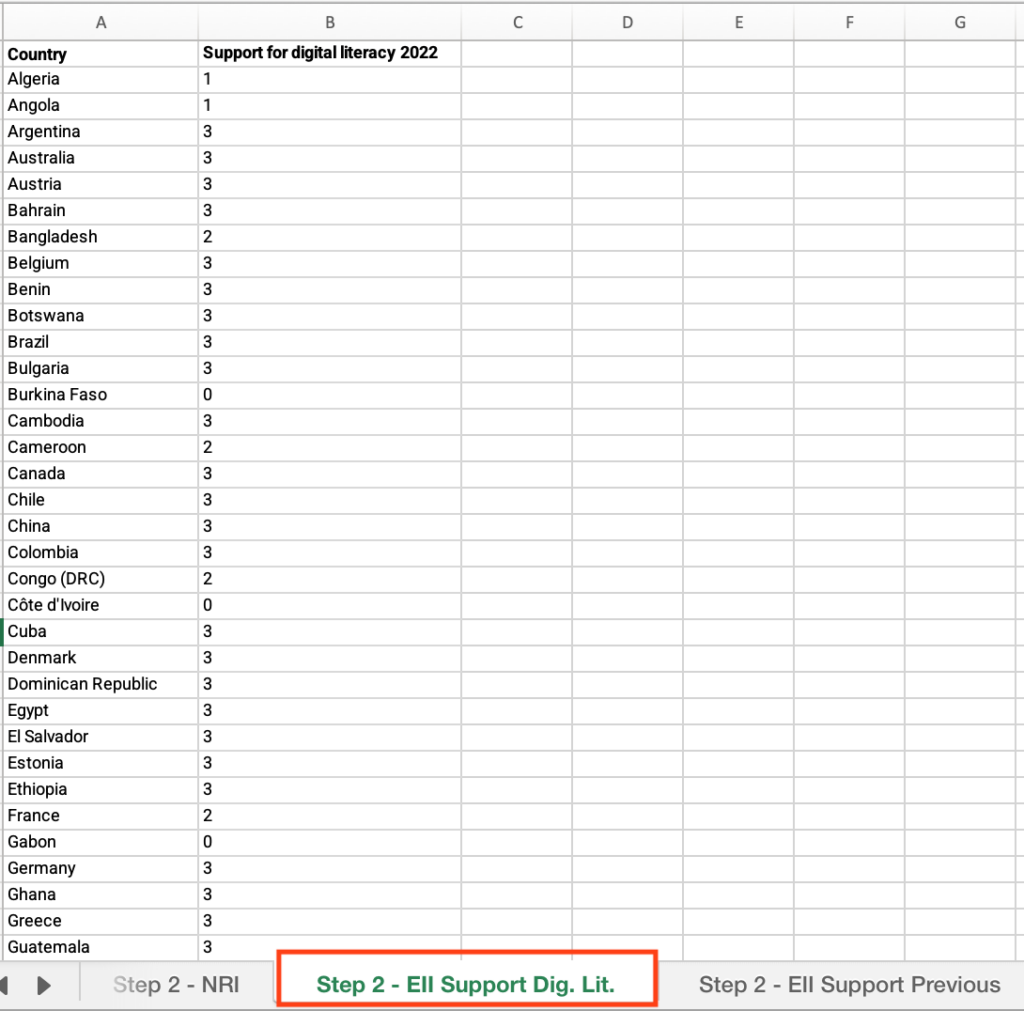
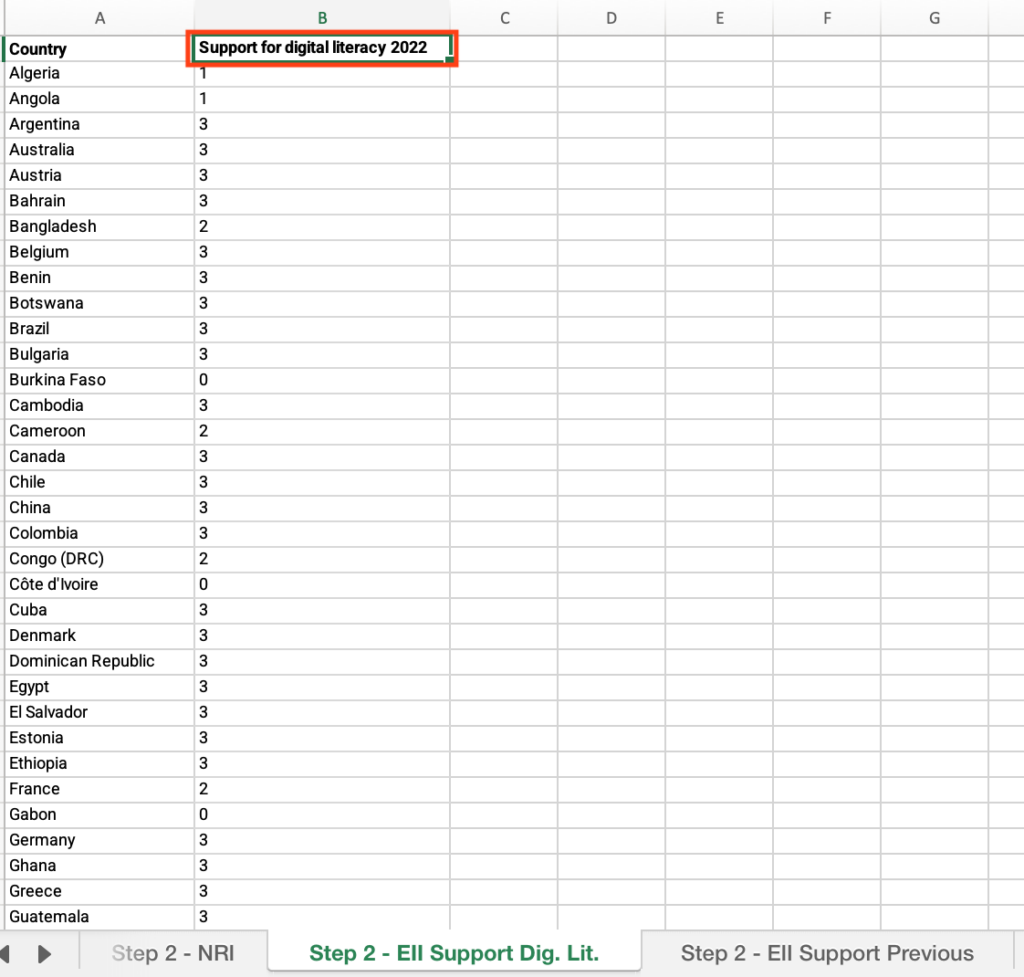
- Locate the “Country” column > Filter by your country.
- Locate the “Support for digital literacy 2022” column > Find the value and answer the question on the platform.
Step 2: When assessing the score of previous editions (years), has there been an improvement in this indicator?
- Open the “Step 2 – EII Support Previous” sheet.
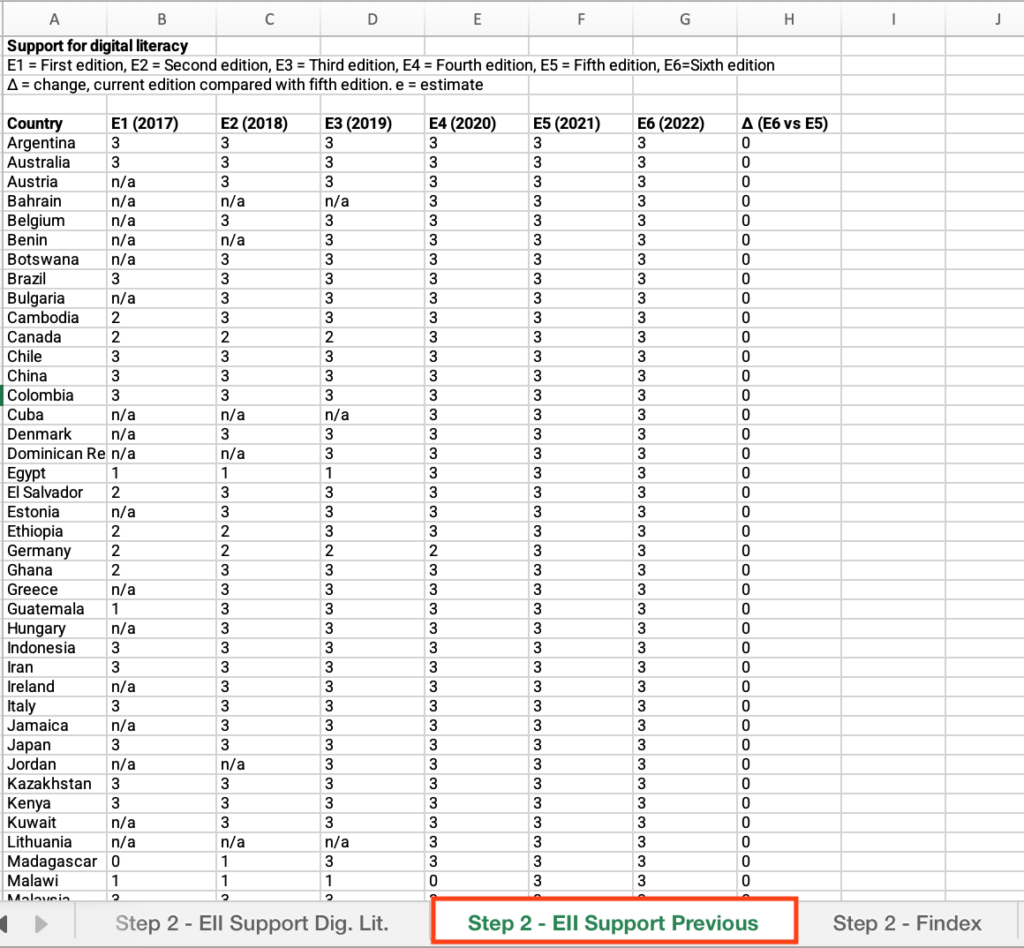
- Locate the “Country” column > Filter by your country.
- Locate the “Δ (E6 vs E5)” column > Find the value and answer the question on the platform.
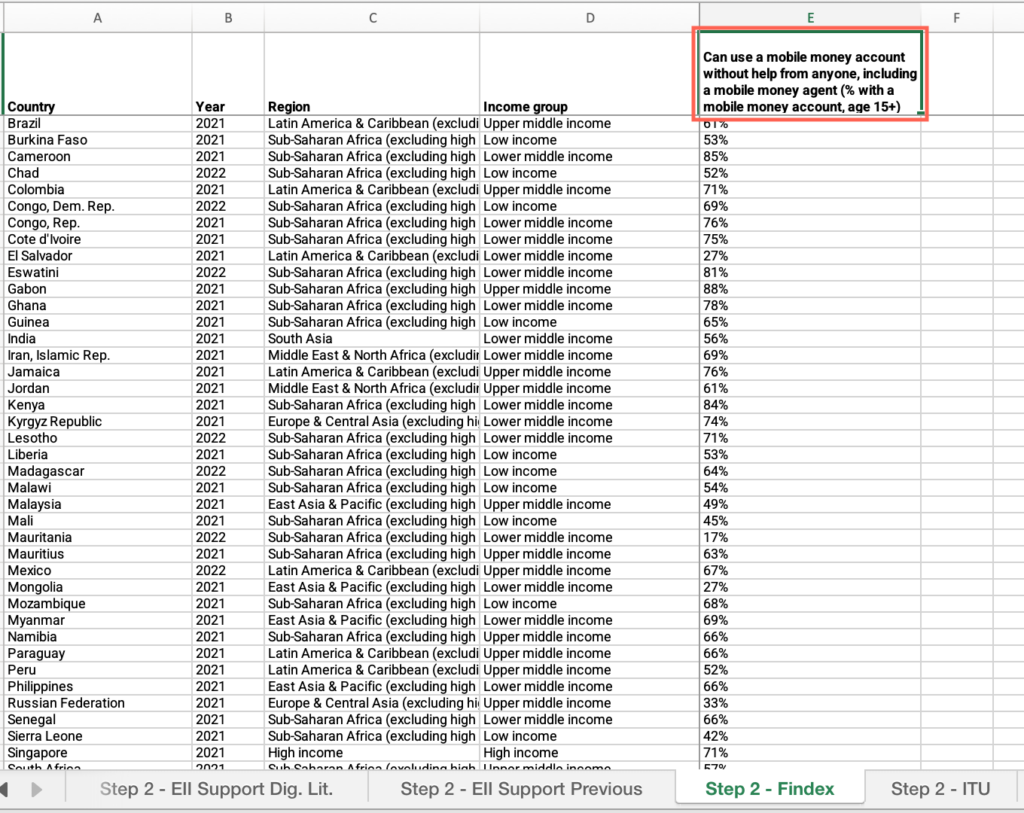
Step 2: Can the large majority of adults (more than 70 percent) that have a mobile money account use it without any help?
- Open the “Step 2 – Findex “ sheet.
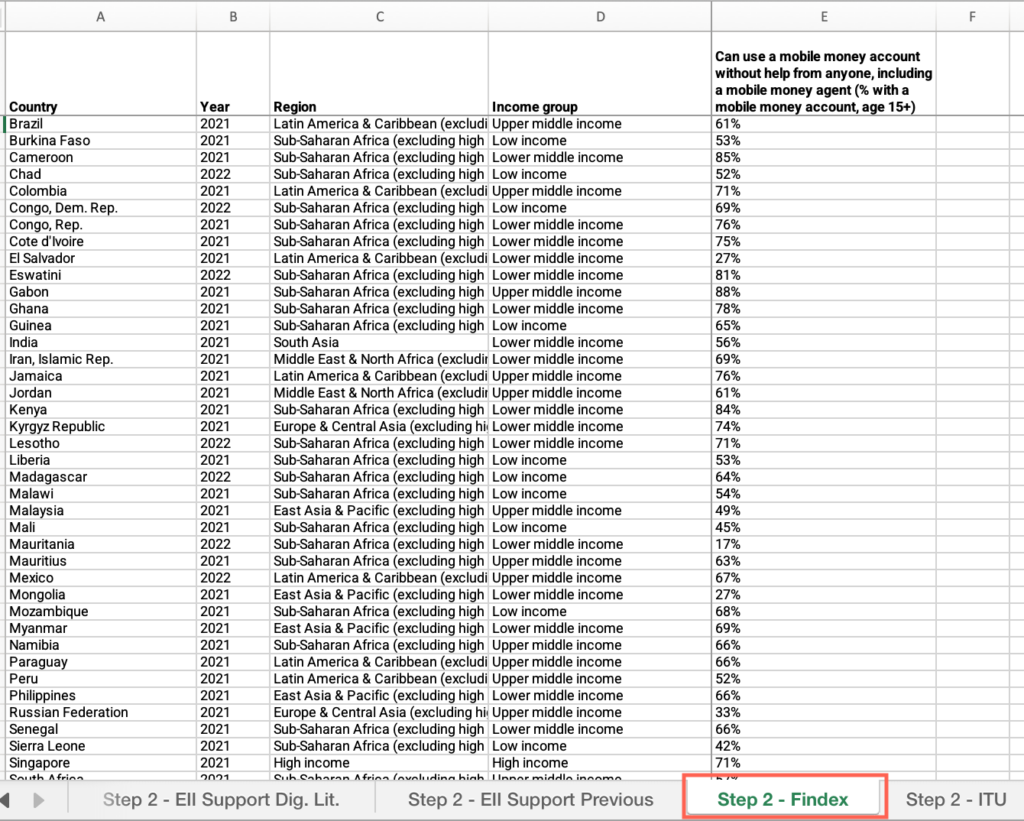
- Locate the “Country” column > Filter by your country.
- Locate the “Can use a mobile money account without help from anyone, including a mobile money agent (% with a mobile money account, age 15+)” column > Find the value and answer the question on the platform.
Step 2: Is the percentage of people who do not have access to the internet because they perceive they do not need it higher than the average for non-high-income countries (low income, lower middle income, upper middle-income countries)?
- Open the “Step 2 – ITU” sheet.
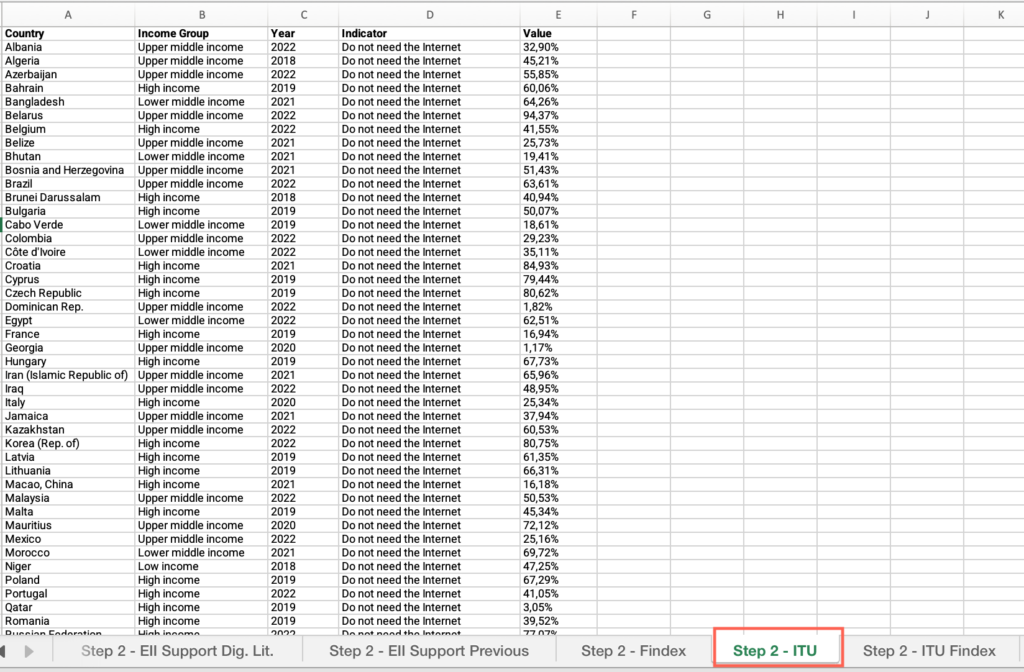
- Locate the “Country” column > Filter by your country.
- Locate the “Value” column > Find the value.
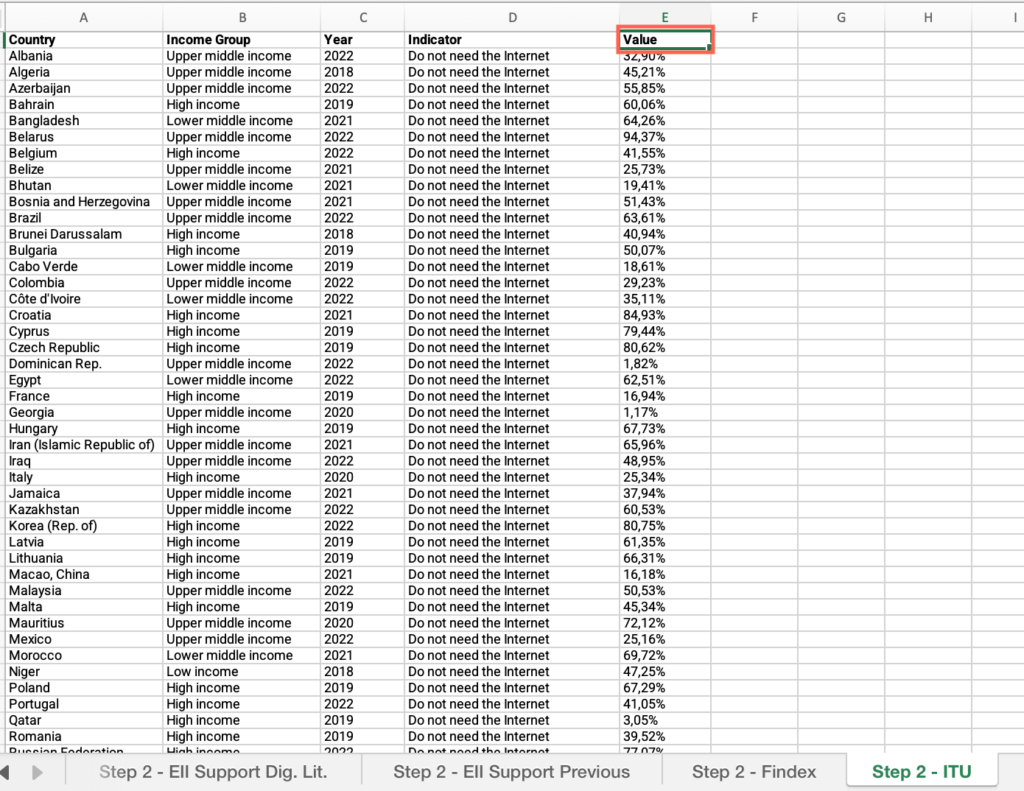
- Locate the “Country” column > Check “Select all.”
- Locate the “Income Group” column > Apply the filter > Uncheck the box next to “High income.”
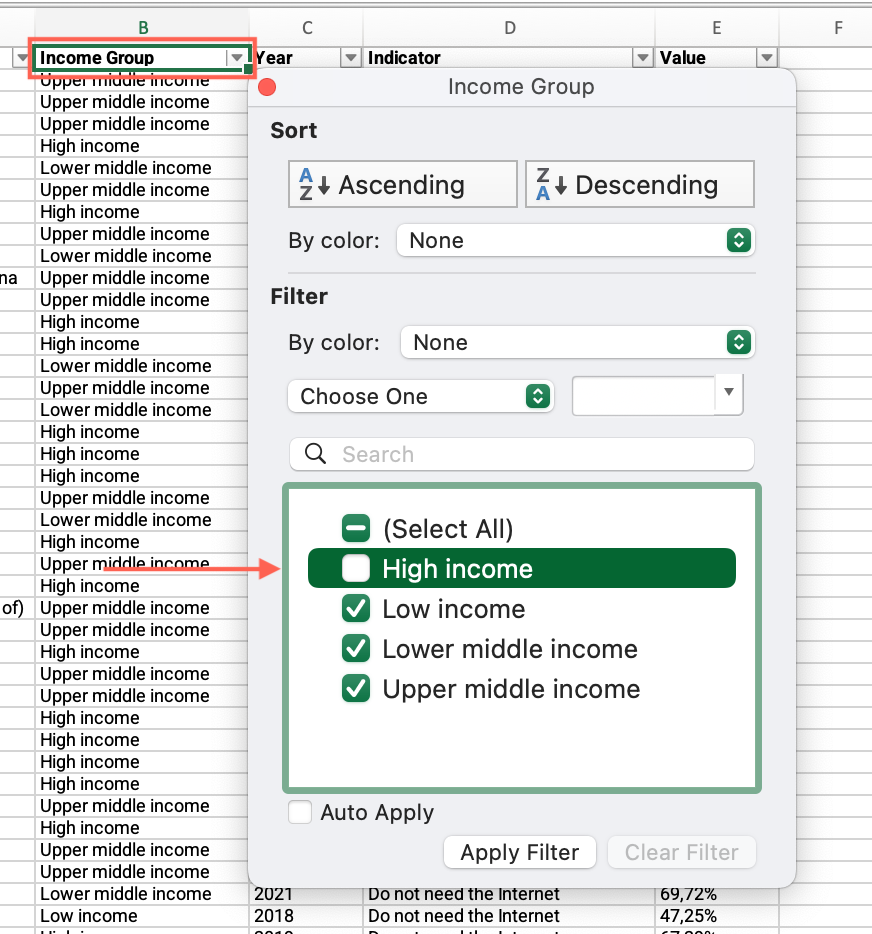
- Locate the “Value” column > Click and drag to select the entire range of cells under this column > See the average at the bottom of the sheet.
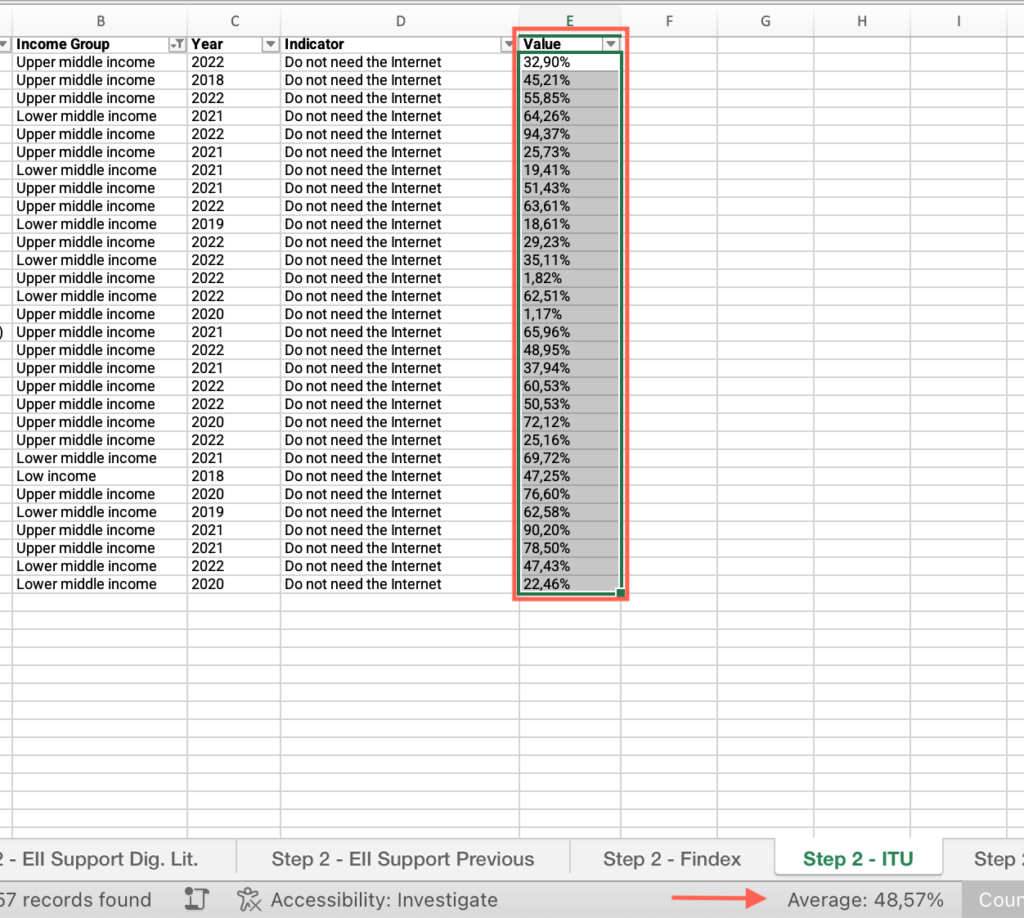
- Compare your country’s value with the average for non-high-income countries and answer the question on the platform.
Step 2: Can your country be characterized as having a combination of: (a) high percentage of the population without internet arguing that they don’t need the internet (more than 50 percent) and (b) a low (< 70%) or very low (< 40%) percentage of the population owning an account?
- Open the “Step 2 – ITU Findex” sheet.
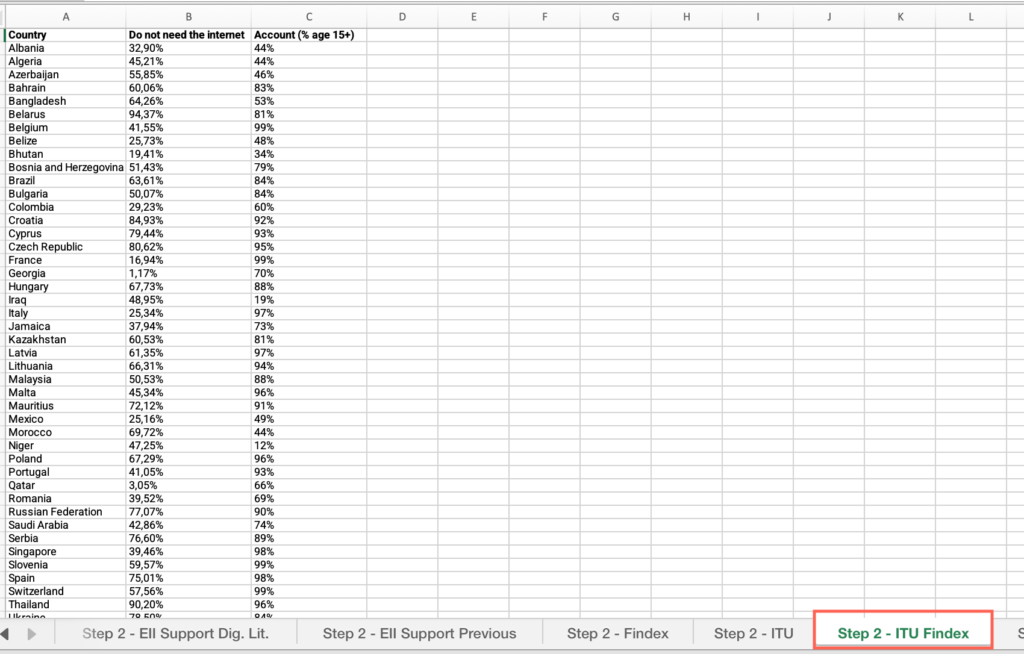
- Locate an empty cell outside the data range, not associated with any row or column containing data > Click on the empty cell.
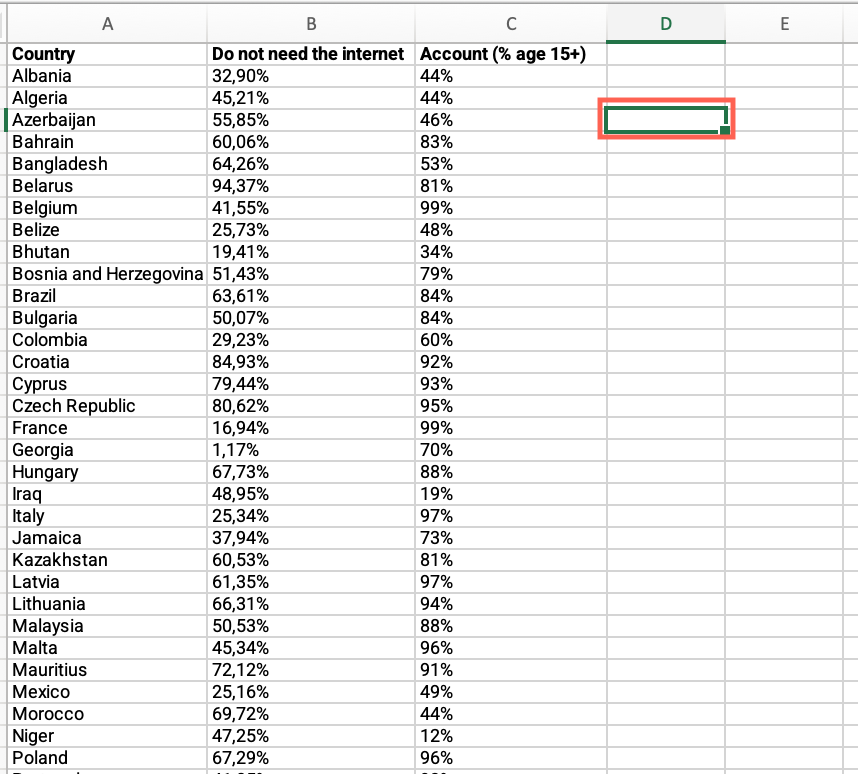
- Click the Insert menu > Locate the charts icons > click the Scatter plot icon > select “Scatter.”
- Click on the chart area > Click the Chart Design menu > click “Select data.”
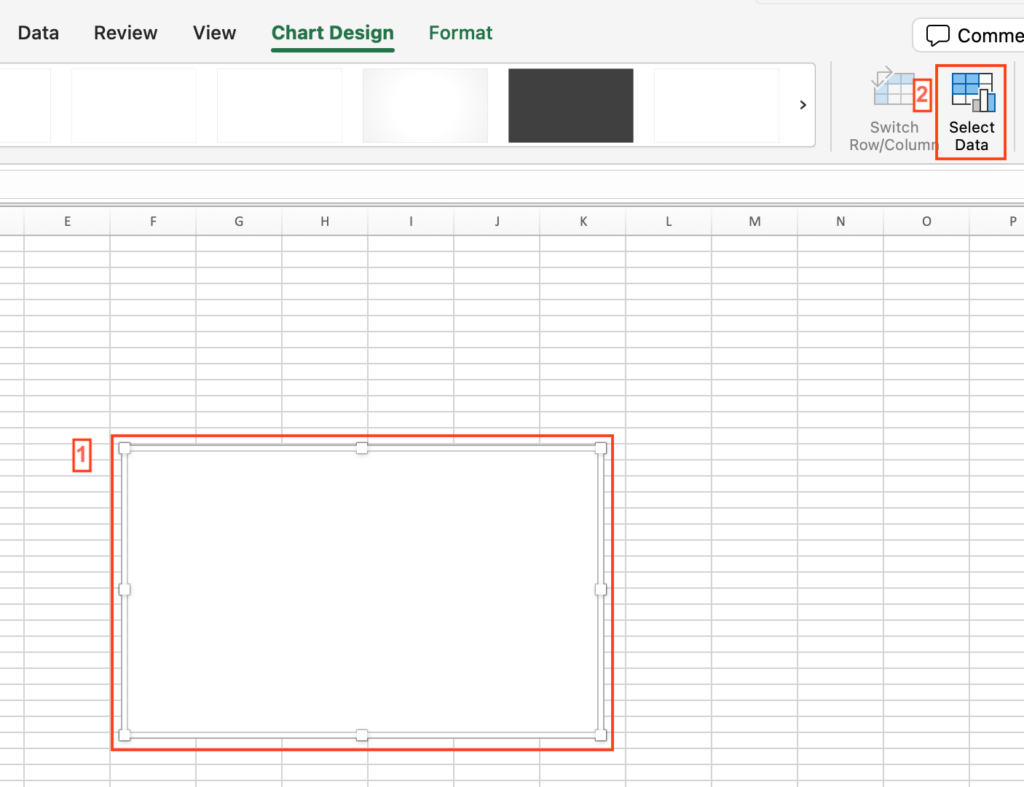
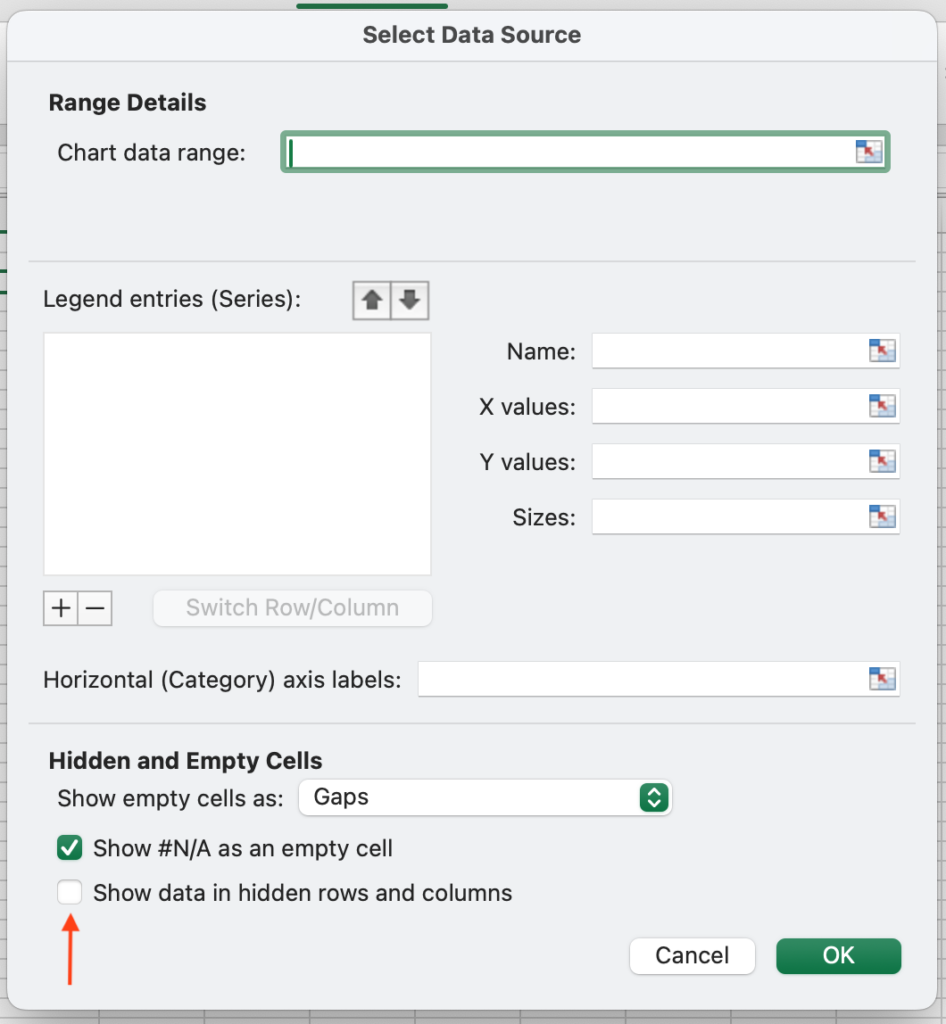
- Make sure the “Show data in hidden rows and columns” checkbox from the “Hidden and Empty Cells” options is unmarked. .”
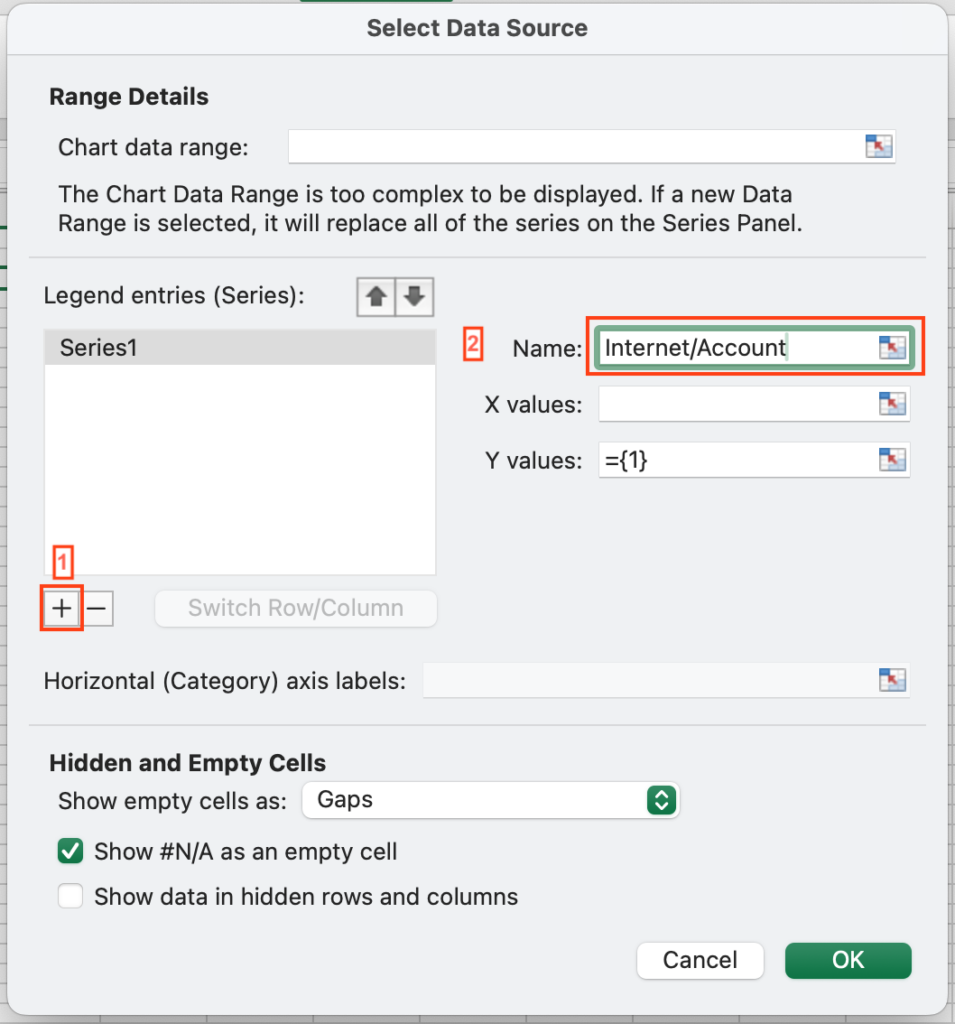
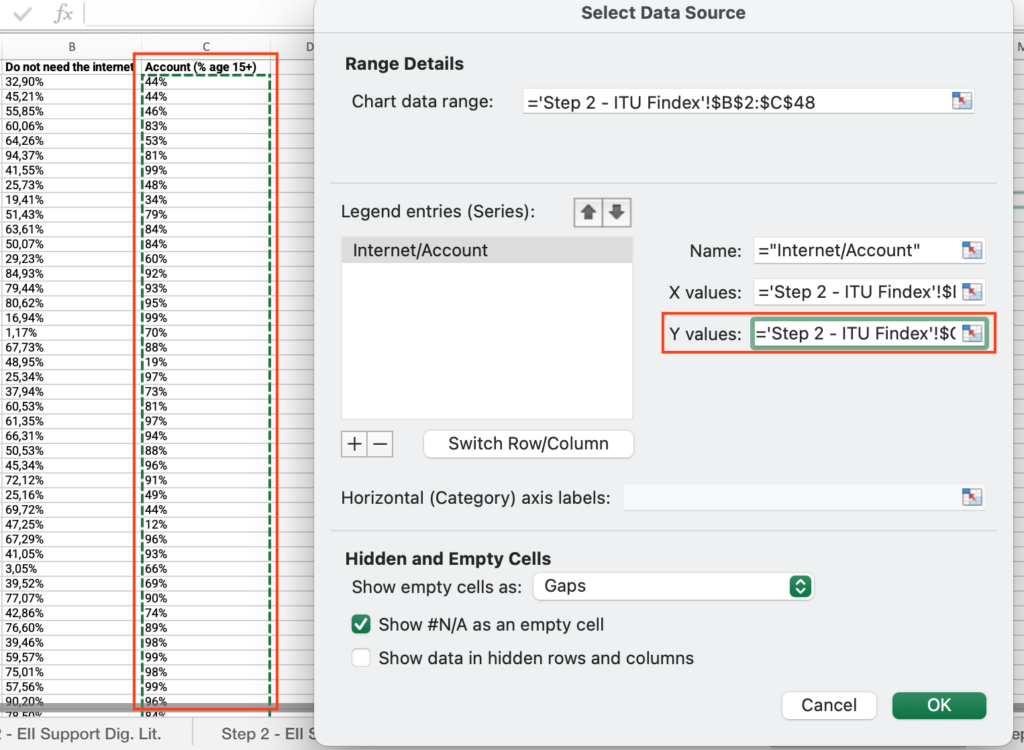
- Click on the + sign to add a series > In the “Series name” field, type “Internet/Account.”
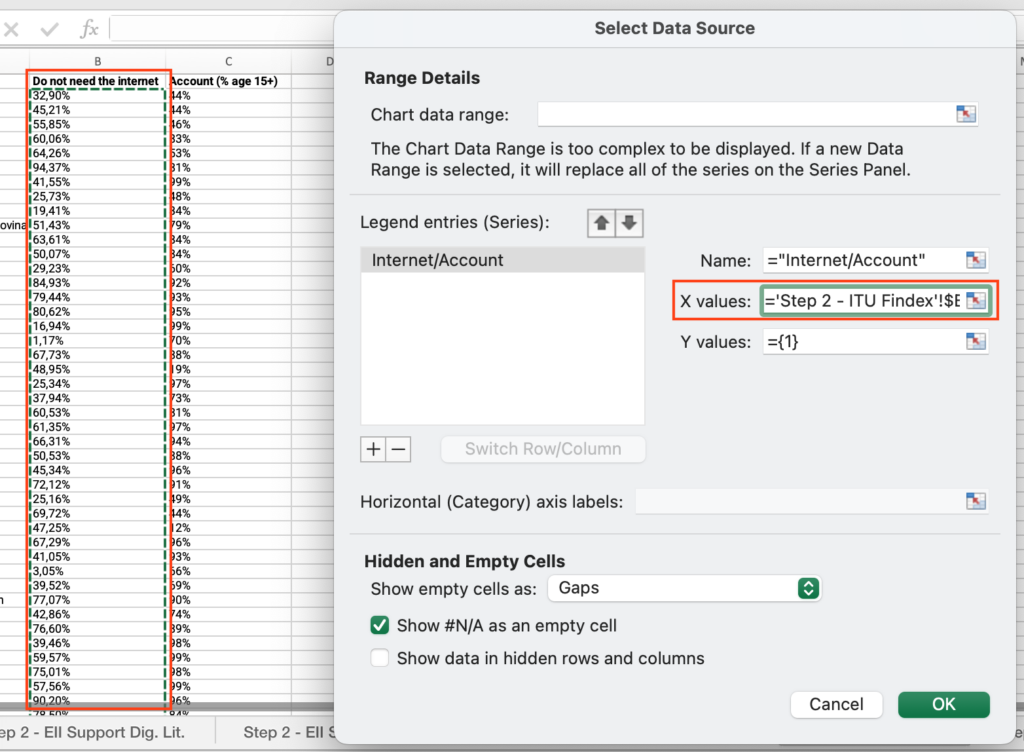
- Click the “X values” field > Select all cells under the “Do not need the internet” column.
- Click the “Y values” field > Select all cells under the “Account (% age 15+)” column. Press “OK“
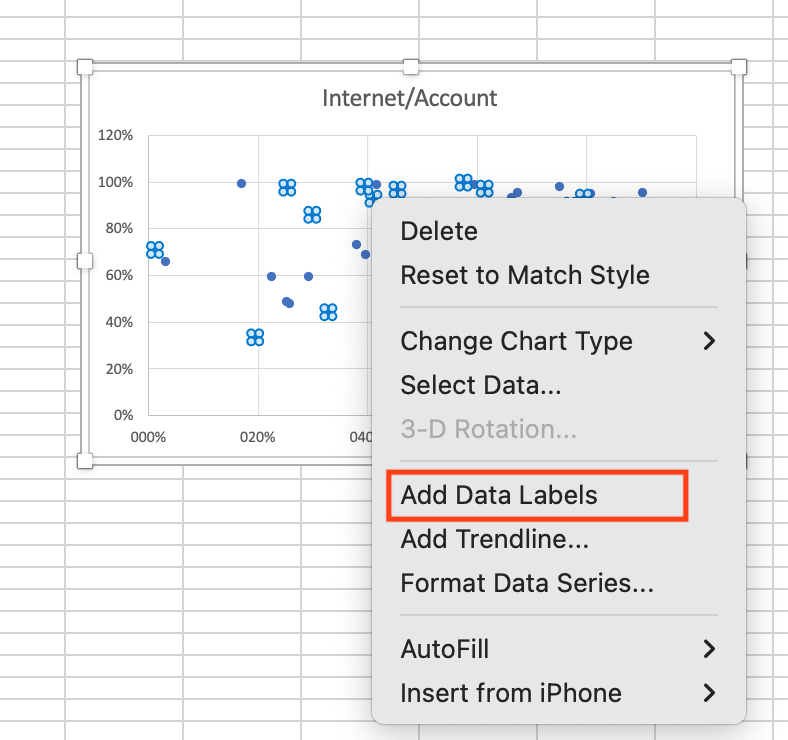
- Right click on one of the data points > select “Add data label.”
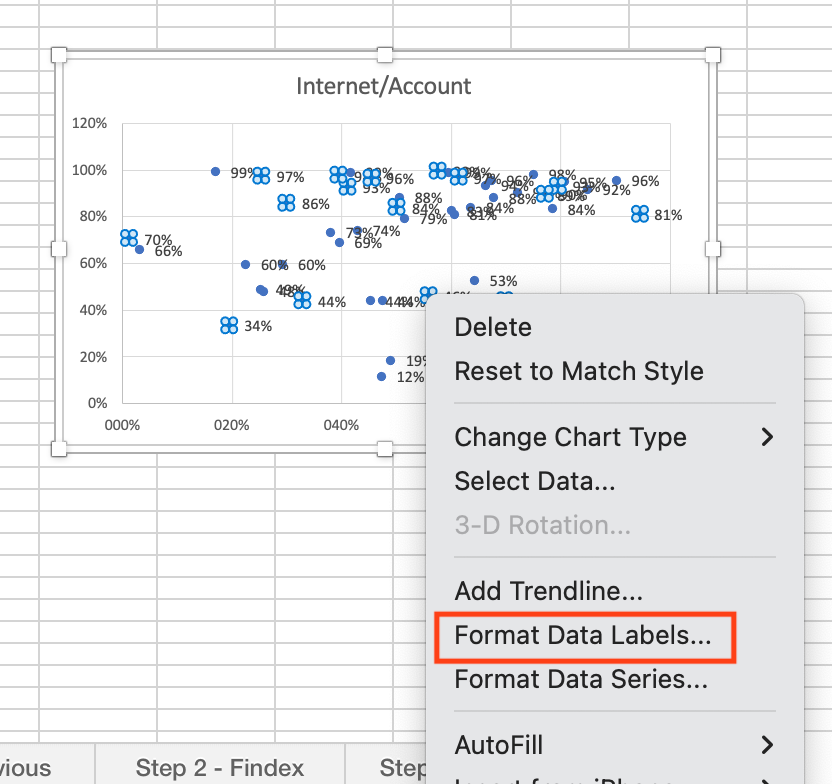
- Right click on one of the data points > select “Format data label.”
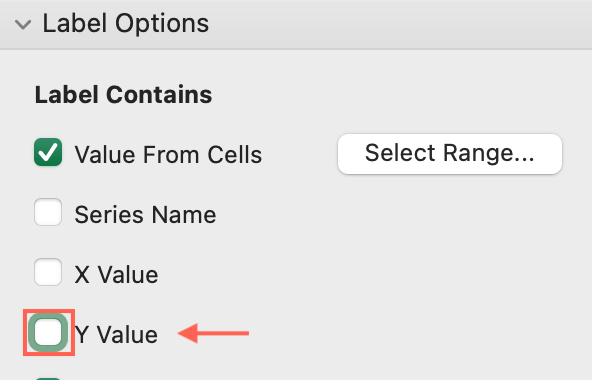
- Under “Label contains” check “Value from cells” > Select all cells with values under the “Country” column > Press OK.

- Uncheck “Y value.” ADD SCREENSHOT GRAPH 12
- Analyze the outcome and answer the question on the platform.
Step 2: Does your country implement programs to improve digital literacy and awareness?
- Open the “Step 2 – FICP Fin capability” sheet.
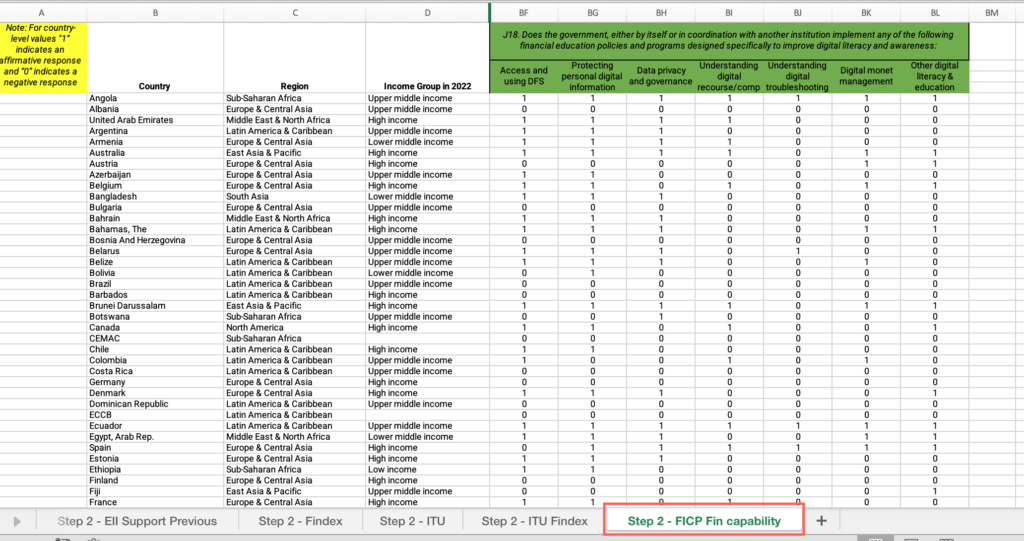
- Locate the “Country” column > Filter by your country.
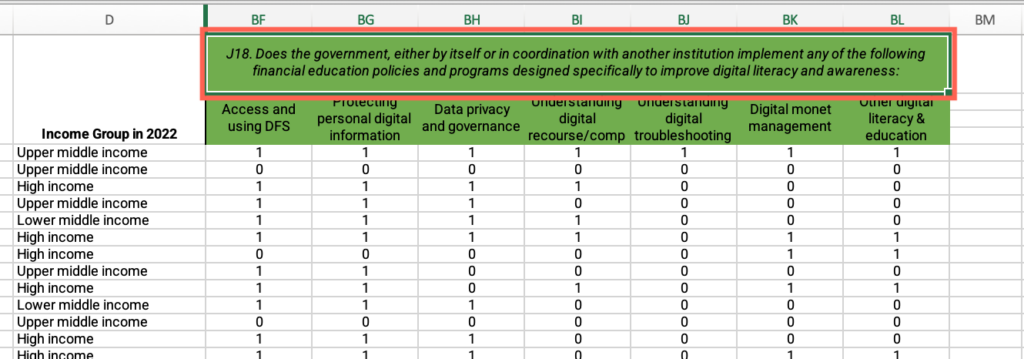
- Locate the “Government, either by itself or in coordination with another institution implement any of the following financial education policies and programs designed specifically to improve digital literacy and awareness” cell > Find the values and answer the question on the platform.
